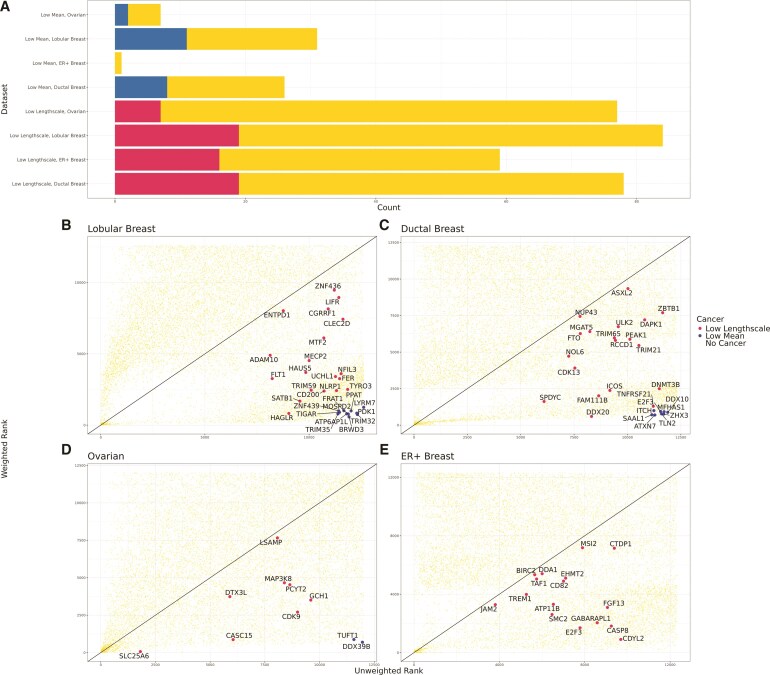
Fig. 5.
Spoon helps to detect SVGs associated with cancer that are lowly expressed. We used four datasets to evaluate the detection of cancer-related genes: ER+ Breast cancer (Wu et al. 2021a), Ovarian cancer (Denisenko et al. 2024), Lobular Breast cancer (10x Genomics 2020), and Ductal Breast cancer (10x Genomics 2022). A) Each bar contains the intersection of the set of genes of interest with genes within the set associated with cancer. For the first four rows, we defined low mean genes as those with means less than the 25th percentile in the dataset. Within the set of low mean genes, we found genes that were in the lowest 10% of ranks before weighting and then increased to the highest 10% of ranks after weighting. This is the set of genes of interest. The intersection in blue is the number of low mean and higher ranked genes that were found to be associated with the cancer of the dataset. For the last four rows, we defined low lengthscale genes as those with lengthscales between 40 and 90. Within the set of low lengthscale genes, we found genes that were ranked higher after weighting. This is the set of genes of interest. The intersection in pink shows the number of low lengthscale genes that were ranked higher and found to be associated with the cancer type of the dataset. B)–E) Within each dataset, the unweighted rank of each gene is plotted on the x-axis and the weighted rank on the y-axis. The genes related to cancer are labeled and colored by low lengthscale or low mean.

