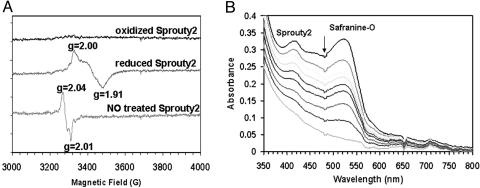
Fig. 1.
EPR and redox measurement of Sprouty2 protein. (A) EPR spectra of purified Sprouty2 proteins. (Top trace) Oxidized Sprouty2; (middle trace) Sprouty2 anaerobically reduced with 10 mM dithionite; (bottom trace) Sprouty2 after mixing with NO saturated buffer (2 mM). Protein concentrations were ≈100 μM. Experiments were performed by using a Bruker EMX 6/1 spectrometer operating in X-band mode. Conditions: microwave power 3.99 mW, modulation frequency 100 kHz, modulation amplitude 20 G (1 G = 0.1 mT), and temperature 100 K. (B) Spectral changes during anaerobic photoreduction of Sprouty2. A solution of Sprouty2 was dissolved in buffer with safranine-O and a catalytic concentration of 5-deazariboflavin and placed in a quartz cuvette under an atmosphere of nitrogen. After each step of photoreduction, a spectral scan was taken subsequent to the point at which the redox state of protein and dye had reached equilibrium. The arrow indicates the absorbance decayed upon photoreduction

