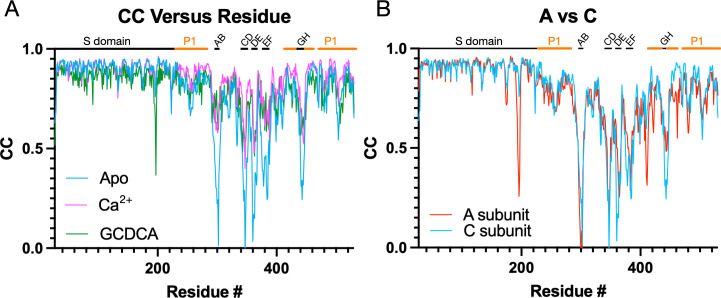
Fig 6.
Comparisons of the per-residue correlation coefficients among the three structures. (A) Shown here are the per-residue CC for the C subunits in the presence and absence of bile or calcium ions. The locations of the outermost loops are noted at the top of the graph, and the P1 domain is noted by the orange bars. Although the apo form is in the activated state, the loops are significantly less ordered than when bile or calcium is present. (B) Shown here are the per-residue CC of the A versus C subunits in the apo V330I structure. While both structures have highly mobile loops, the A subunit appears less ordered in several loops and from residue 400 onward.

