
Figure 10.
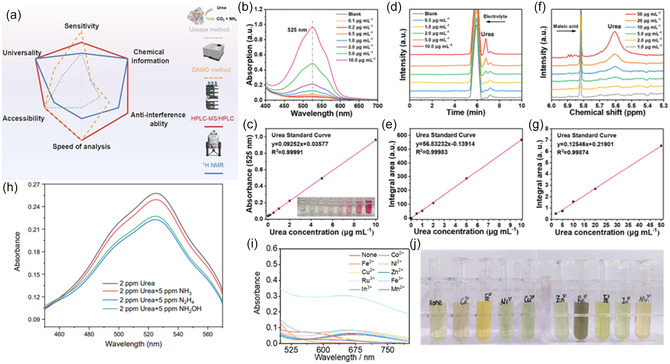
a) The comparison of four urea detection methods. Reproduced with permission.[ 90 ] Copyright 2023, Elsevier. b) Proposed quantitative steps of photo‐/electrocatalytic urea synthesis based on the M‐DAMO‐TSC method. Measurement data and corresponding standard curve of urea determined by b,c) DAMO‐TSC; d,e) HPLC; and f,g) NMR methods. Reproduced with permission.[ 92 ] Copyright 2023, Wiley‐VCH. h) UV‐vis absorption spectra of 2.0 ppm urea with 5.0 ppm N2H4, NH3, and NH2OH quantified by diacetyl monoxime method. i) UV‐vis spectra of indophenol blue method for ammonia obtained after the decomposition of 2 ppm urea with 25 ppm metal ions, and j) the corresponding photography of color substance. Reproduced with permission.[ 90 ] Copyright 2023, Elsevier.