
Figure 5.
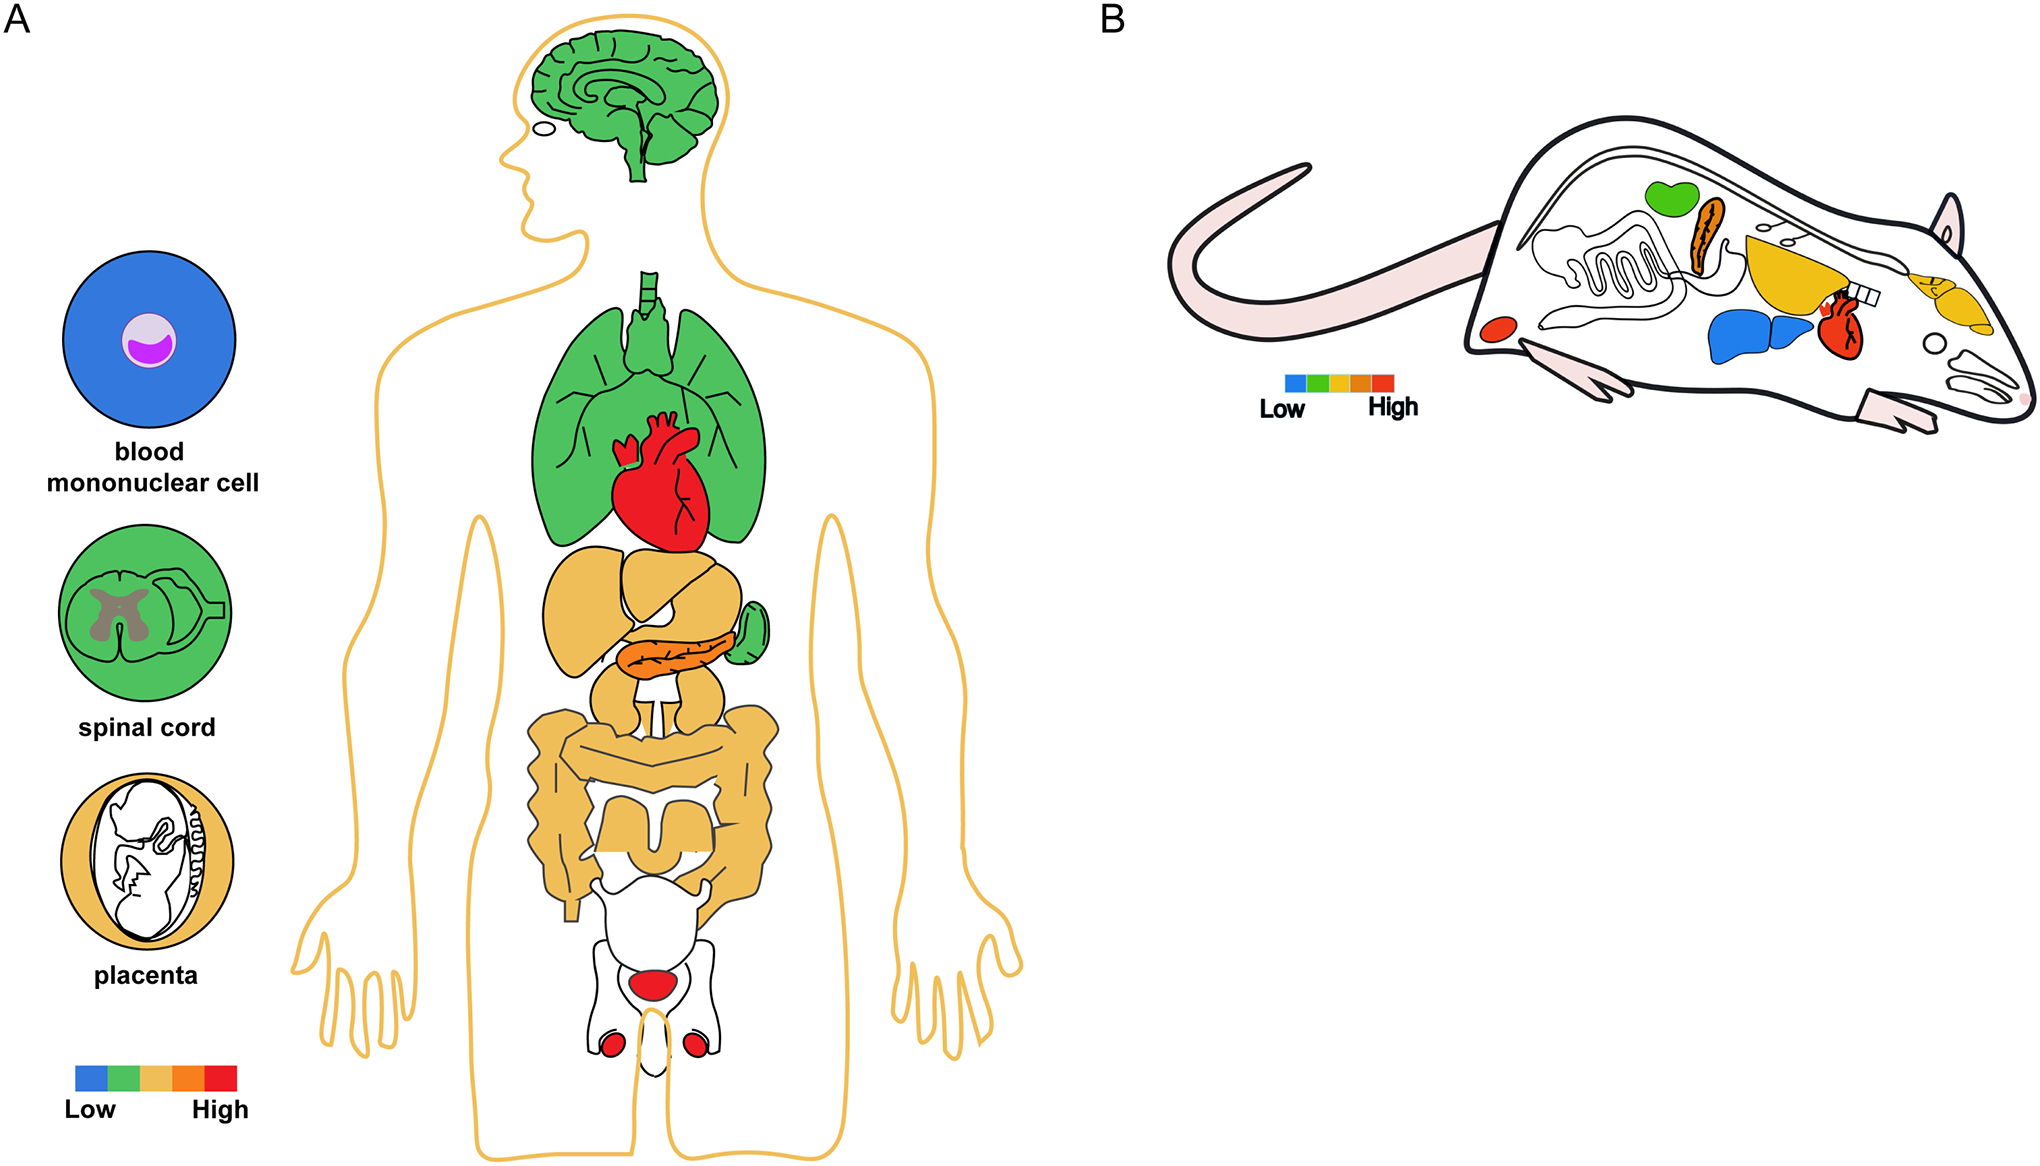
Summary of reported TRPM4 distribution in human (A) and rodents (B). The color scale indicates relative levels of expression based on consensus of reports in the literature. The colored circles depict TRPM4-expressing specific cells, tissues or organs in humans.