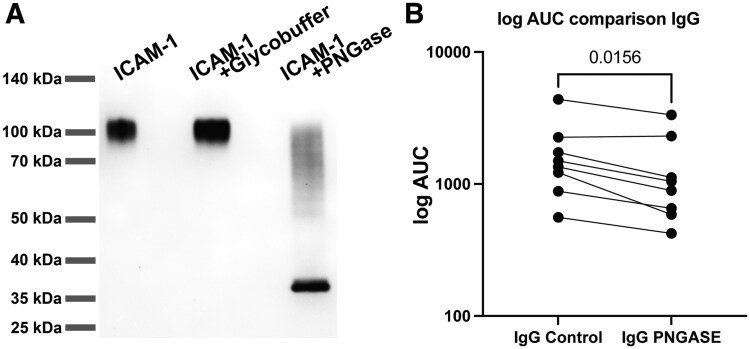
Figure 7.
Anti-ICAM-1 IgG autoantibodies interact with protein glycans. (A) SDS-PAGE separation of ICAM-1 under nonreducing conditions. Lane 1 shows ICAM-1 protein, lane 2 shows ICAM-1 in reaction buffer without PNGase F, and lane 3 shows ICAM-1 with PNGase F. Molecular masses are displayed on the left margin in kDa. (B) Dot plot graph of the AUC of the optical density at 450 nm on the log y-axis obtained by ELISA for determining the levels of ICAM-1 IgG autoantibodies targeting ICAM-1 with glycans (control) compared with enzymatically deglycosylated ICAM-1 (PNGASE) within plasma with high levels of detected ICAM-1 autoantibodies, defined as the top 8 positive samples by qualitative ELISA regardless of disease group (n = 8). Statistical significance was determined using the Wilcoxon matched pairs signed rank test. P value results are shown.

