
Figure 3.
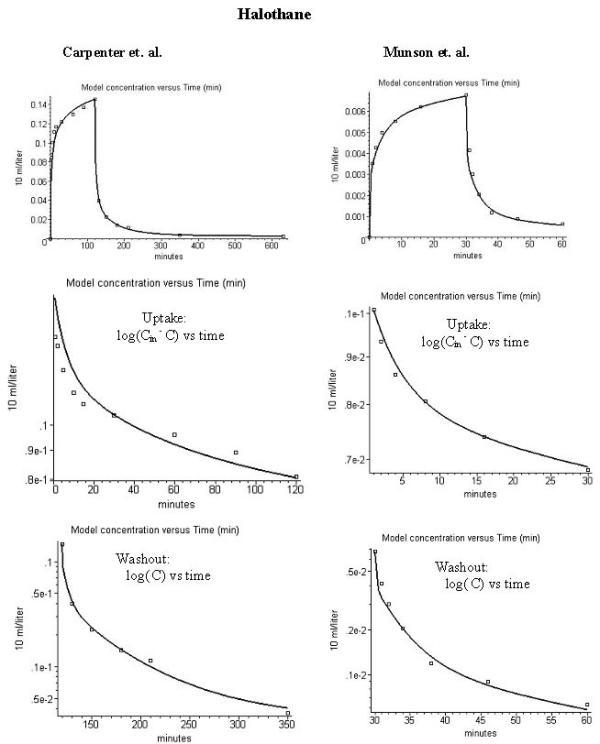
Comparison of model alveolar gas concentration (line) and experimental data for the end tidal concentration (volume %) during uptake and washout of halothane. The left column is for the data of carpenter et al. [28] (inspired concentration = 0.226%) and the right column is for the data of Munson et al. [4] (inspired concentration = 0.0135%). The figures in the 3 rows are similar to those in fig. 1.