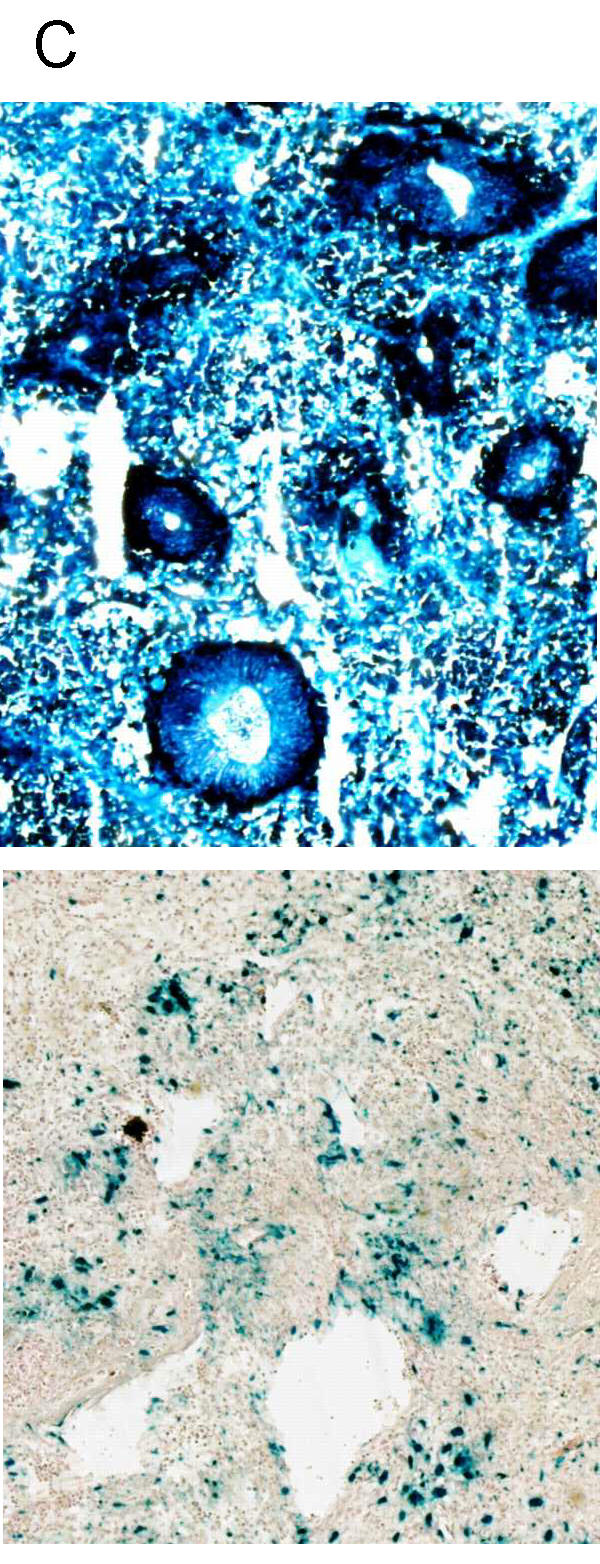
Figure 2.

Distribution of adenoviral infection in the tumours. Histological sections (magnification × 50) of L42 (above) and L44 (below) tumours stained for β-galactosidase (blue). The necropsy was performed 2 days after intra tumoral injection of 1010iu Ad Adapt LacZ, when the tumours were about 10 × 10 × 10 mm.
