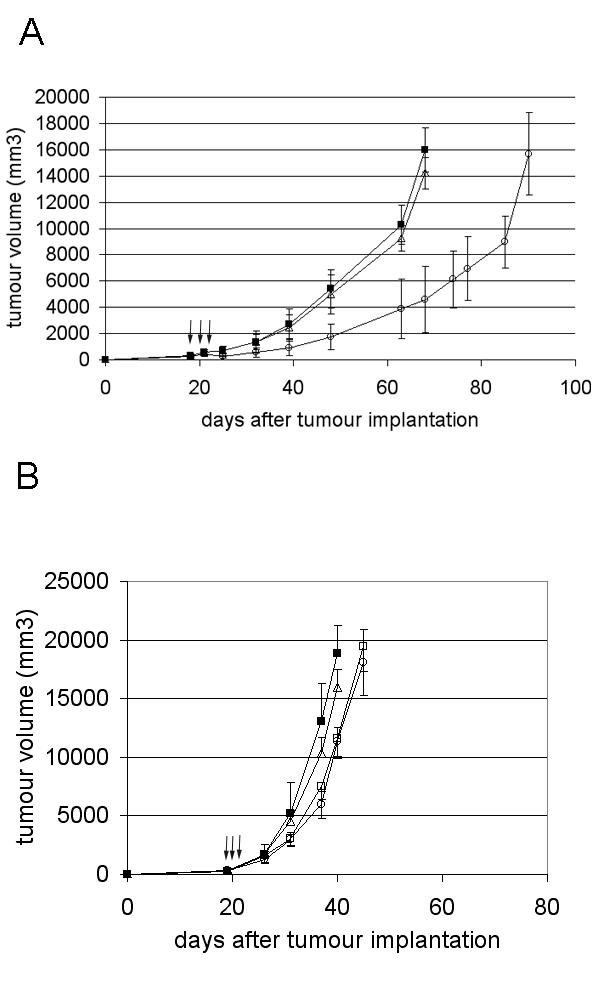
Figure 8.

Tumour response after local injection of 3 consecutive doses of 1010iu. A: L42 tumour treated with Ad Adapt mhATF-BPTI (open circles, p < 0.0001 ANOVA), Ad Adapt mhATF (open triangles), and Ad Adapt empty (closed squares). Arrows indicate the days of injection (19 – 21) and the tumours were 8 × 8 × 8 mm at the first day of injection. 10 animals per group, vertical lines indicate SD. B: L44 tumour after treatment with 1010iu Ad Adapt mhATF-BPTI (open circles), Ad Adapt mhATF (open squares), Ad Adapt hEndostatin (open squares), and Ad Adapt empty (closed squares). Arrows indicate the days of injection (19 – 21) and the tumours were 8 × 8 × 8 mm at the first day of injection. 5 animals per group, vertical lines indicate SD.
