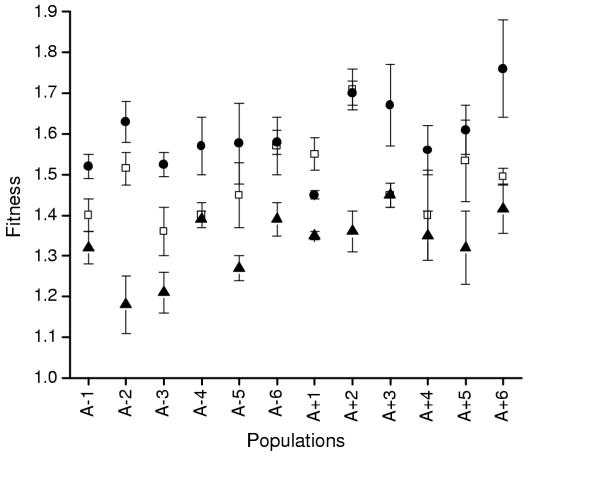
Figure 2.
Mean fitness (± SE) relative to the ancestor of evolved populations when measured in the experimental environment at varying concentrations of glucose. Each point is the mean of 3 random clones, each replicated twice. Open squares: 2.5 μg/ml glucose; closed circles: 25 μg/ml glucose; closed triangles: 250 μg/ml glucose.

