Figure 5.
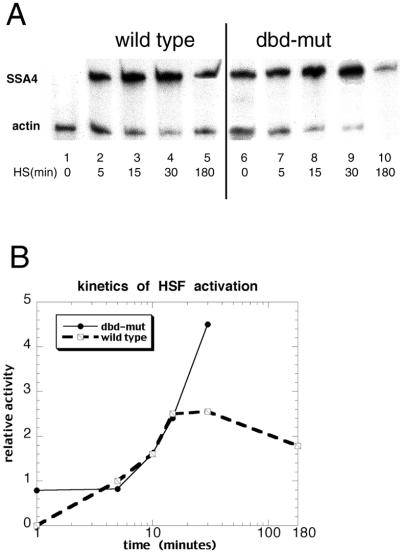
Kinetics of wild-type and dbd-mut HSF activation. (A) Primer extension analysis of the activation kinetics of wild-type and dbd-mut HSFs. Cells were harvested after 0, 5, 15, 30, or 180 min of heat shock, and HSP70 mRNA levels were measured by primer extension. Actin mRNA was measured at the same time as internal control. dbd-mut HSF (lanes 6–10) is activated slower than wild type (lanes 1–5). (B) Kinetics plot of wild-type and dbd-mut HSFs activation. The units are arbitrary. The ratio of HSP70 mRNA transcription to actin mRNA transcription at 5 min of heat shock in wild-type cells was set to 1, and all of the other quantitative data (obtained from PhosphorImager plate) were normalized accordingly. The x axis is drawn logarithmically. The transcriptional activities of dbd-mut HSF after 30 min of heat shock were not shown, because progressive cell death caused inaccurate measurement.

