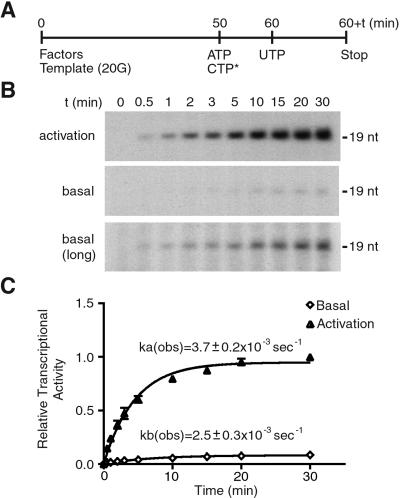
Figure 6.
Kinetic analysis of promoter escape in activated transcription. (A) Diagram illustrating the experimental design for in vitro transcription reactions. Ten-fold scales of transcription reactions were performed by using pG5HMC2AT+20G (template 20G), and aliquots were withdrawn at the indicated time points (60 + t). (B) Time course of promoter escape in the presence (activation, Top) or absence (basal, Middle and Bottom) of GAL4-VP16 and PC4. The Bottom (basal, long) indicates the 4-fold longer exposure of the Middle. The position of the 19-nt transcript is indicated. (C) Quantification of the time course of promoter escape. ka(obs) and kb(obs) indicate the observed rate constants for activated transcription and basal transcription, respectively. The values (means ± SD) at each time point from three independent experiments are plotted.

