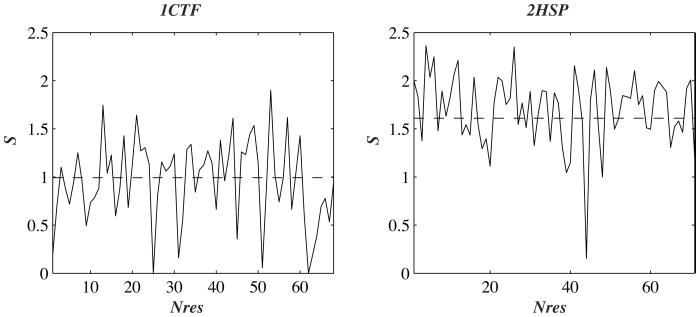
Figure 3.
The entropy in sequence space of each residue of 1ctf and 2hsp is plotted against the position of the residue in the sequence of the protein. The continuous line shows the design entropy Sdes, whereas the dashed line shows the average entropy per residue derived from the sequences of proteins whose structure in the PDB were found similar to the structure of 1ctf or 2hsp, according to the FSSP database (28).

