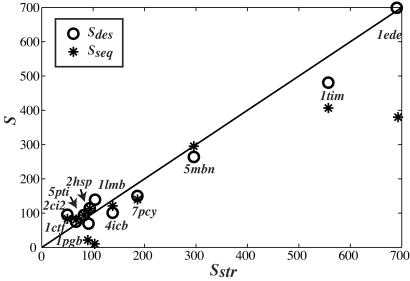
Figure 4.
The sequence entropy [Sseq (*)] and the design entropy [Sdes (○)] are plotted against the entropy derived from structural information (Sstr) for a data set of 11 proteins. The line represents the first diagonal, i.e., the line where the different entropy measures would be identical. The correlation coefficient between Sseq and Sstr is 0.92, whereas the correlation coefficient between Sdes and Sstr is 0.99.

