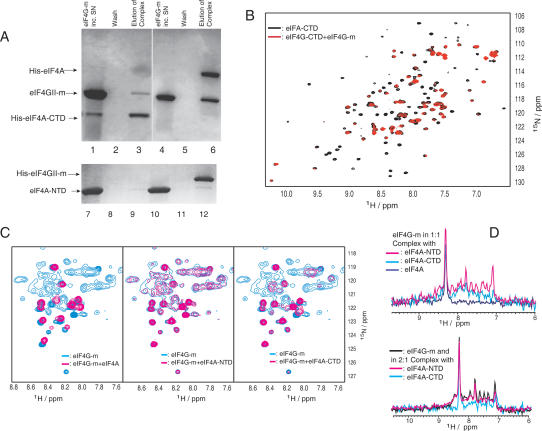
Figure 1.
Binding of eIF4G-m to eIF4A detected by pull-down assays and NMR spectroscopy. (A) Lanes 1-6 depict the His-tag pull-down experiments when immobilized His8-eIF4A-CTD (lanes 1-3) and His6-eIF4A (lanes 4-6) were incubated with eIF4G-m (lanes 1,4). (Lanes 2,5) Unbound eIF4G-m was eluted completely by extensive washing steps. Bound eIF4G-m was eluted as a complex with eIF4A-CTD (lane 3) and eIF4A (lane 6). Lanes 7-12 show the reverse pull-down when untagged eIF4A-NTD was incubated on a control resin (lanes 7-9) and a resin with immobilized His6-eIF4G-m (lanes 10-12). After washing (lanes 8,11), bound proteins were eluted (lanes 9,12). (B) A characteristic overlay of 1H-15N-HSQC spectra of 15N-labeled eIF4A-CTD (500 μM) in free form (black) and complexed with the middle domain eIF4G-m (600 μM, red). (C) Overlays of 1H-15N-HSQC spectra of free 15N-labeled eIF4G-m (330 μM, blue) and 1:1 complexes of 15N-labeled eIF4G-m (130 μM, magenta) with equimolar amounts of full-length eIF4A (left), eIF4A-NTD (middle), and eIF4A-CTD (right) in buffer containing 300 mM NaCl. All spectra were acquired with the same number of scans. The intensities in the spectra of free 15N-labeled eIF4G-m were scaled to account for the difference in concentration. (D) 1D cross-sections of two-dimensional (2D) 1H-15N-HSQC spectra of free and complexed eIF4G-m taken at 119 ppm. The top and bottom panels show 1D slices as observed during titrations with buffer containing 300 and 100 mM NaCl, respectively. The different colors correspond to free eIF4G-m (black) and to eIF4G-m in complex with eIF4A-NTD (magenta), with eIF4A-CTD (cyan), and with eIF4A (navy).

