



Abstract
Analysis across a growing number of single-cell perturbation datasets is hampered by poor data interoperability. To facilitate development and benchmarking of computational methods, we collect a set of 44 publicly available single-cell perturbation–response datasets with molecular readouts, including transcriptomics, proteomics and epigenomics. We apply uniform quality control pipelines and harmonize feature annotations. The resulting information resource, scPerturb, enables development and testing of computational methods, and facilitates comparison and integration across datasets. We describe energy statistics (E-statistics) for quantification of perturbation effects and significance testing, and demonstrate E-distance as a general distance measure between sets of single-cell expression profiles. We illustrate the application of E-statistics for quantifying similarity and efficacy of perturbations. The perturbation–response datasets and E-statistics computation software are publicly available at scperturb.org. This work provides an information resource for researchers working with single-cell perturbation data and recommendations for experimental design, including optimal cell counts and read depth.
Perturbation experiments probe the response of cells or cellular systems to changes in conditions. These changes traditionally acted equally on all cells in a laboratory experiment by, for example, modifying temperature or adding drugs. Nowadays, with advanced functional genomics techniques, single-cell genetic perturbations acting on individual cellular components are available. Perturbations using different technologies target different layers of the hierarchy of protein production (Fig. 1). At the lowest layer, CRISPR-cas9 acts directly on the genome, using insertion–deletion polymorphisms to induce frameshift mutations that effectively knock out one or multiple specified genes1-3. Newer CRISPRi and CRISPRa technologies inhibit or activate transcription, respectively4. CRISPR-cas13 acts on the next layer in the hierarchy of protein production to promote RNA degradation5. Small molecule drugs, in contrast, typically act directly on protein products such as enzymes and receptors. When these techniques are applied to large-scale screens they create a map between genotype, transcripts, proteins, chromatin accessibility and, in some cases, phenotype6. Barcodes associated with unique CRISPR guide perturbations are read alongside single-cell RNA sequencing (scRNA-seq), CITE-seq (cellular indexing of transcriptomes and epitopes by sequencing) or scATAC-seq (single-cell sequencing assay for transposase-accessible chromatin) to identify each cell’s perturbation condition2,6-9.
Fig. 1. Perturbation–response profiling for single cells.
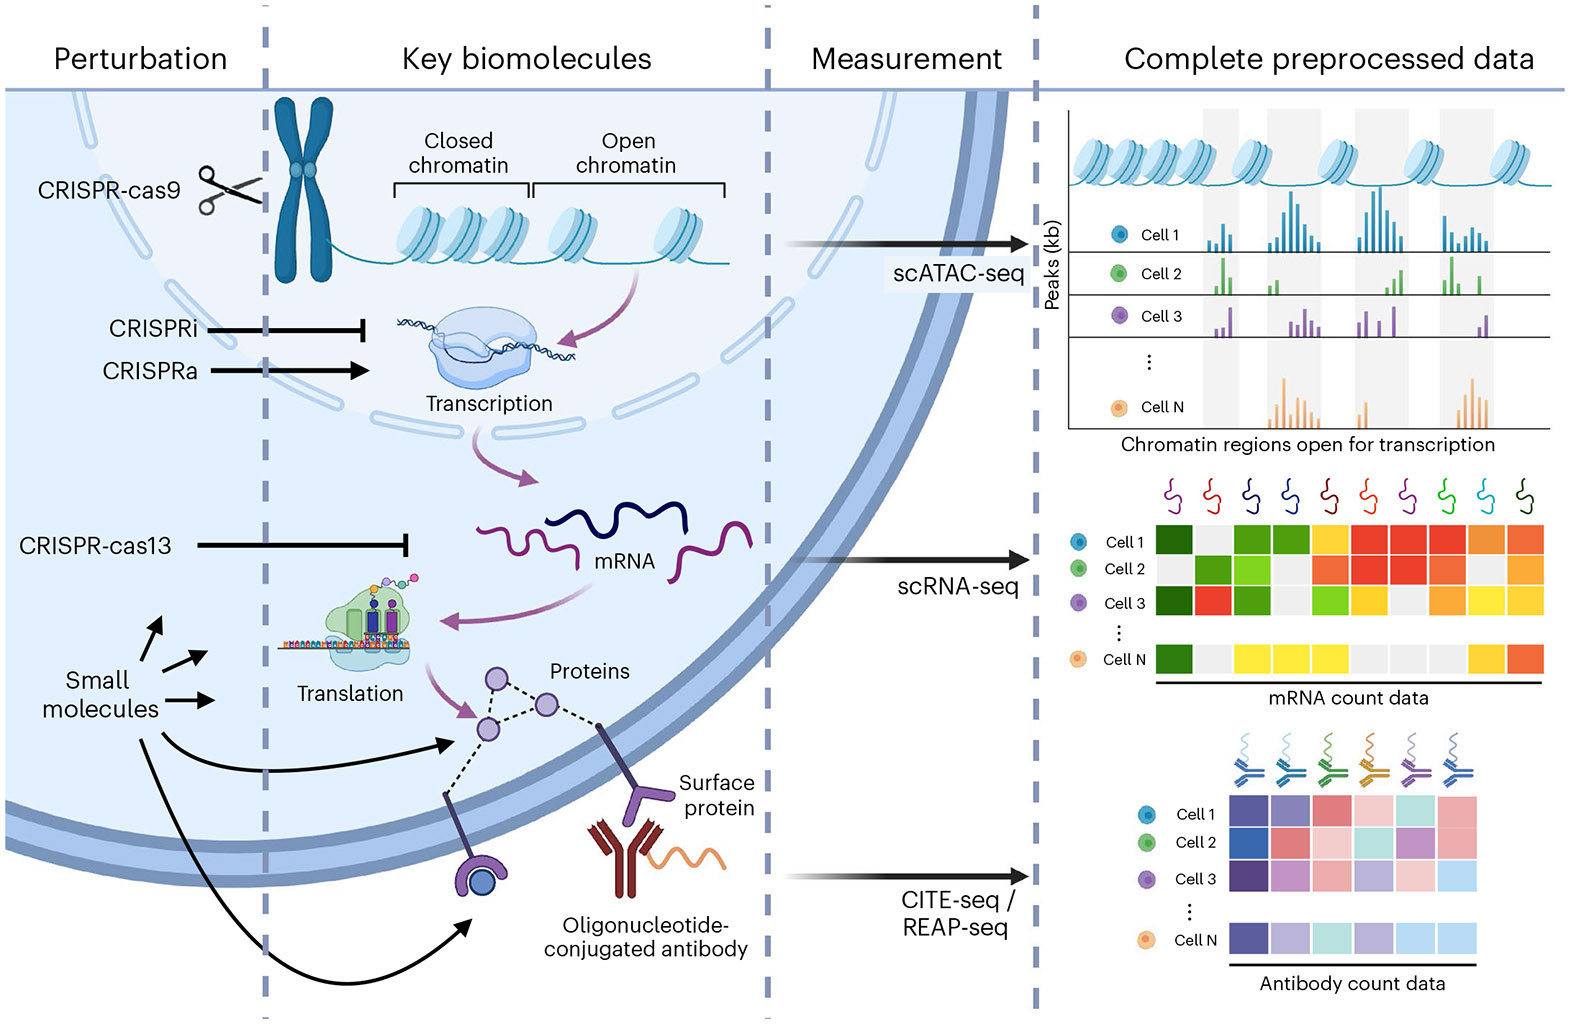
Different perturbations act at different layers in the hierarchy of gene expression and protein production (purple arrows). Perturbations included in scPerturb include CRISPR-cas9, which directly perturbs the genome; CRISPRa, which activates transcription of a target gene; CRISPRi, which blocks transcription of targeted genes; CRISPR-cas13, which cleaves targeted mRNAs and promotes their degradation; cytokines that bind cell surface receptors; and small molecules that perturb various cellular mechanisms. Single-cell measurements probe the response to perturbation, also at different layers of gene expression: scATAC-seq directly probes chromatin state; scRNA-seq measures mRNA; and protein count data currently is typically obtained via antibodies bound to proteins. REAP-seq, RNA expression and protein sequencing.
Large-scale single-cell perturbation–response screens enable exploration of complex cellular behavior inaccessible in bulk measurements. Directionality in regulatory network models cannot be inferred without interventional or time-series data10. Experiments with targeted perturbations can be modeled as affecting individual nodes of a regulatory network model, enabling investigation of mechanistic processes and inference of regulatory interactions and their directionality11. Typically, however, perturbation datasets have been too small to elucidate the complexity of cellular systems; thus, accurately predictive models of regulatory interactions remain difficult to infer12. This limitation will be reduced as dataset size continues to increase. More directly, drug screens have been used to suggest therapeutic interventions by analyzing detailed molecular effects of targeted drugs, and designing new single or combinations of perturbations13-15.
Reliable analysis of increasingly large perturbation datasets requires efficient statistical tools to harness large numbers of cells and perturbations. The inherently high dimensionality of perturbation–response data complicates calculation of distances between perturbations, as does cell-to-cell variation and data sparsity16. There is presently no convention for statistical comparison of response profiles in perturbation studies. Some studies carry out pseudo-bulk calculations by combining all cells in a given perturbation setting1,7. This means losing information about the cell-to-cell variation in response. Studies with mixtures of cell types have developed complex methods for quantifying similarity between heterogeneous cell populations17-19. Cell-based statistical measures can be used to identify successfully perturbed cells but do not currently quantify similarity of perturbation effects2,9. Ideally, statistical comparisons between perturbations and quantification of perturbation strength should be based on a multivariate distance measure between sets of cells. Such a distance measure describes the difference or similarity between the expression profiles of cells treated with distinct perturbations, thus inferring unique or shared mechanisms or identifying perturbation targets, which tend to produce similar shifts in molecular profiles20,21. Multiple distance measures for scRNA-seq have been explored by the single-cell community in recent years, including Wasserstein distance computed in an optimal transport framework22,23, maximum mean discrepancy24, neighborhood-based measures17,18, and energy distance (E-distance)20. Here, we exclusively use E-distance, a fundamental statistical measure of distances between point clouds that can be used in a statistical test to identify strong or weak perturbations as well as to distinguish between perturbations affecting distinct cellular sub-processes. The associated energy test (E-test) is a statistically reliable tool for computational diagnostics of information content for a specific perturbation, and can inform design of experiments and data selection for training statistical models of perturbation effects.
Large perturbation screens are specifically designed to study a particular system, such as a cell line, under a set of perturbations of interest. Over time, the field has accumulated a heterogeneous assortment of single-cell perturbation–response data with a wide range of different cell types, such as immortalized cell lines and induced pluripotent stem cell-derived models, and different perturbation technologies, including knockouts, activation, interference, base editing and prime editing25. Computational methods to efficiently harmonize these different perturbation datasets are needed. Such integrative analysis is complicated by batch effects and biological differences between primary tissue and cell culture26,27. Published computational methods for perturbation data are primarily focused on individual datasets28-30. Moving from single-dataset to multi-dataset analysis requires development of quantitative approaches to perturbation biology.
Although several large databases of perturbations with bulk readouts exist, single-cell perturbation technologies are newer and the data are not unified31,32. Existing collections of datasets are primarily a means for filtering and do not supply a unified format for perturbations33-35. However, unified datasets are key to developing generalizable machine learning methods and establishing multimodal data integration. A recent review and repository of single-cell perturbation data for machine learning lists 22 datasets but supplies cleaned and format-unified data for only six36. Unified frameworks for accessing single-cell data are in active development, but do not currently support perturbation datasets or standardize perturbation annotations37,38.
We provide scPerturb, a resource of standardized datasets reporting targeted perturbations with single-cell readouts to facilitate the development and benchmarking of computational approaches in systems biology. We collected 44 publicly available perturbation–response datasets from 25 publications (Table 1 and Supplementary Fig. 1b). Our quantification of perturbation strength and comparison of experiment-specific variables, such as the number of perturbations and the number of cells per perturbation, may serve as a reference for optimal design of future single-cell experiments. We also describe E-distance and E-test as tools for statistical comparisons of sets of cells and benchmark their robustness and applicability for distinguishing perturbations across datasets and modalities. A web interface is accessible at scperturb.org, and packages for single-cell E-statistics are publicly available for both Python (PyPI: scperturb) and R (CRAN: scperturbR).
Table 1.
Key metadata for datasets on scPerturb.org (more details in Supplementary Table 1)
| Source paper | Modality | Perturbation type | No. of perturbations | No. of cells | UMI countsa | Genesa |
|---|---|---|---|---|---|---|
| Adamson7 | RNA | CRISPRi | 9; 20; 114 | 5,768; 15,006; 65,337 | 9,969; 25,082; 15,355 | 2,580; 4,304; 3,690 |
| Aissa68 | RNA | drugs | 4 | 119,071 | 1,312 | 764 |
| Chang69 | RNA | drugs | 4 | 42,277 | 18,961 | 5,278 |
| Datlinger1 | RNA | CRISPR-cas9 +TCRb | 97 | 5,905 | 6,711 | 2,713 |
| Datlinger71 | RNA | CRISPR-cas9 +TCRb | 48 | 39,194 | 1,282 | 364 |
| Dixit2 | RNA | CRISPR-cas9 | 31 | 51,898 | 13,974 | 3,080 |
| Frangieh6 | RNA + protein | CRISPR-cas9 | 249 | 218,331 | 10,988 | 3,314 |
| Gasperini54 | RNA | CRISPRi | 43,314*; 39,087*; 16,531* | 207,324; 47,650; 41,284 | 17,128 | 3,408; 3,795; 3,871 |
| Gehring19 | RNA | drugs | 4 | 20,382 | 2,405 | 1,445 |
| Liscovitch-Brauer59 | ATAC | CRISPR-cas9 | 22; 84 | 8,723; 12,788 | NA | |
| McFarland72 | RNA | drugs, CRISPR-cas9 | 18 | 182,875 | 17,976 | 3,780 |
| Mimitou73 | ATAC + protein | CRISPR-cas9 | 6 | 10,018 | NA | |
| Norman49 | RNA | CRISPRa | 237 | 111,445 | 13,855 | 3,233 |
| Papalexi9 | RNA + protein | CRISPR-cas9 | 11; 99 | 20,729; 8,984 | 11,815; 7,110 | 3,292; 2,530 |
| Pierce42 | ATAC | CRISPRi | 41; 41; 41 | 22,488; 32,831; 18,025 | NA | |
| Replogle20 | RNA | CRISPRi | 2,058; 2,394; 9,867 | 310,385; 1,989,578; 247,914 | 13,207; 11,304; 11,940 | 3,618; 3,215; 3,441 |
| Schiebinger23 | RNA | cytokines | 2; 3 | 68,339; 259,155 | 7,170; 10,271 | 2,358; 2,550 |
| Schraivogel74 | RNA | CRISPR-cas9 | 3,105*; 4,115* | 120,310; 112,260 | 1,557; 1,218 | 60; 61 |
| Shifrut75 | RNA | CRISPR-cas9 +TCRb | 49 | 52,236 | 5,382 | 1,894 |
| Srivatsan52 | RNA | drugs | 5; 8; 189 | 24,262; 98,437; 799,317 | 4,207; 1,502; 1,538 | 2,280; 953; 925 |
| Tian76 | RNA | CRISPRi | 27 | 182,790 | 13,878 | 4,266 |
| Tian21 | RNA | CRISPRa/i | 101; 185 | 21,193; 32,300 | 10,263; 13,609 | 3,613; 4,521 |
| Weinreb77 | RNA | cytokines | 5 | 65,075 | 3,229 | 1,333 |
| Xie78 | RNA | CRISPR-cas9 | 229 | 13,283 | 46,619 | 3,186 |
| Zhao79 | RNA | drugs | 7 | 165,748 | 2,416 | 1,324 |
Perturbation total treats perturbations A, B, and (A and B) as three unique perturbations.
Median per cell in datasets
T-cell receptor (TCR) stimulation.
Results
Molecular readouts for the 44 single-cell perturbation–response datasets include transcript, protein and epigenetic profiles (Table 1 and Fig. 2a). Metadata were harmonized across datasets (Supplementary Table 2). Cells in 32 datasets underwent perturbation using CRISPR, and in 9 datasets the perturbation was done using drugs. While 32 datasets report scRNA-seq exclusively, we also include scATAC-seq from three publications, one with simultaneous protein measurements39. For each scRNA-seq dataset we supply count matrices, in which each cell has a perturbation annotation as well as quality control metrics. Three CITE-seq datasets have protein and RNA counts that are downloadable separately6,9.
Fig. 2. Single-cell perturbation–response datasets are diverse in type, size and quality.
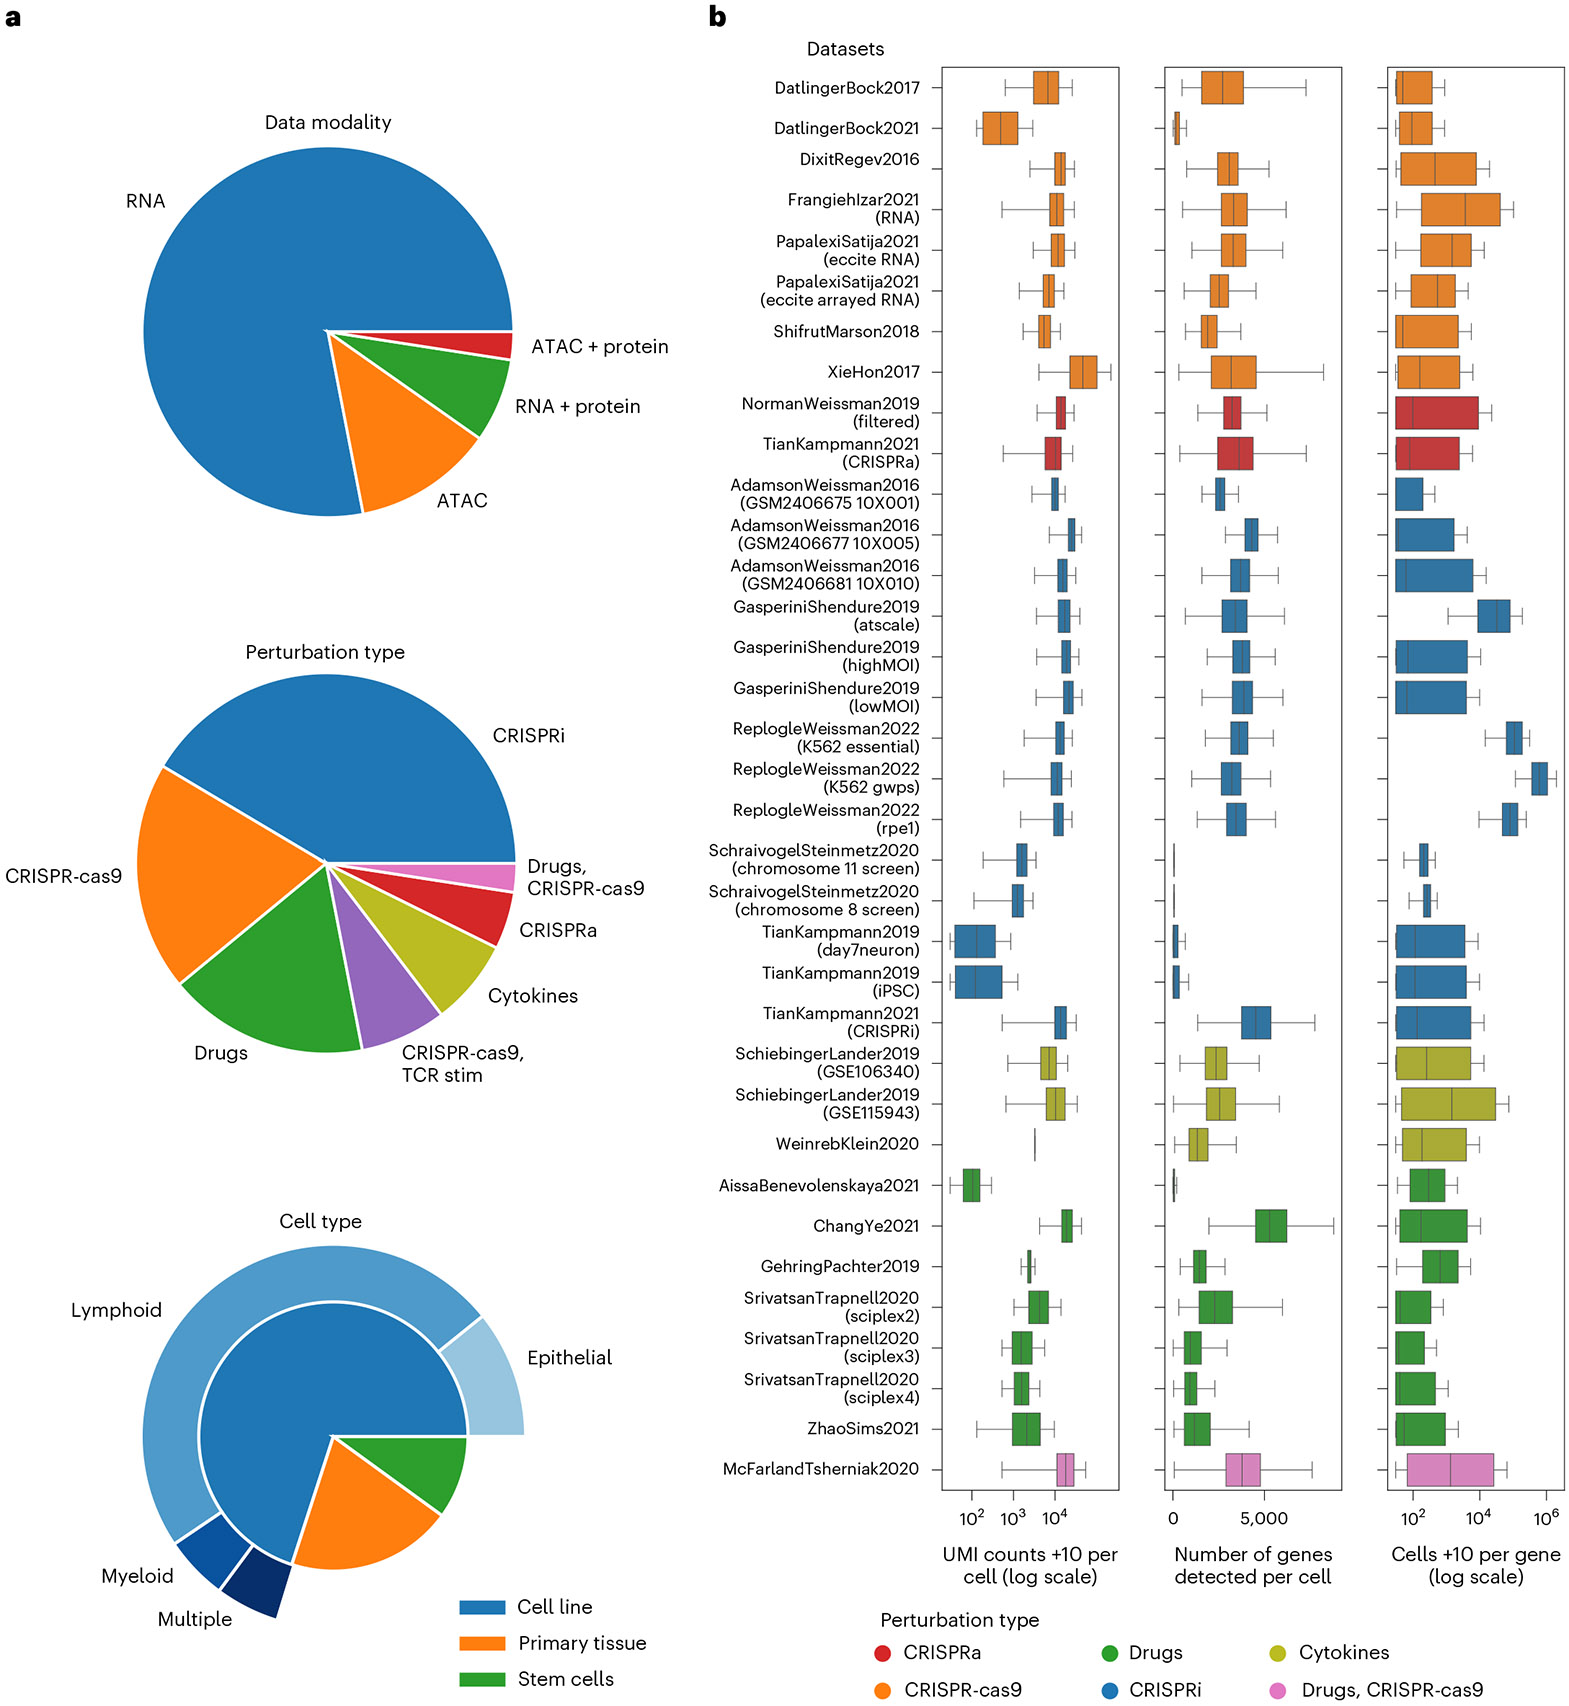
a, Datasets span a multitude of tissues and perturbation types. The majority of included datasets result from CRISPR (DNA cut, inhibition or activation) perturbations using cell lines derived from various cancers. The studies performed on cells from primary tissues generally use drug perturbations. Primary tissue refers to samples taken directly from patients or mice, sometimes with multiple cell types. b, Sequencing and cell count metrics across scPerturb perturbation datasets (rows), colored by perturbation type. From left to right: total RNA counts per cell (left); number of genes with at least one count in a cell (middle); number of cells with at least one count of a gene per gene (right). Most datasets have on average approximately 3,000 genes measured per cell, although some outlier datasets have significantly sparser coverage of genes. Number of cells per experiment (n) is listed in Table 1; average is 160,000; median, 65,000. Center line, median; box limits, upper and lower quartiles; whiskers, 1.5-fold the interquartile range. iPSC, induced pluripotent stem cell; MOI, multiplicity of infection.
In contrast to scRNA-seq data, which can be represented naturally as counts per gene, there is no consensus representation of scATAC-seq data. In its raw form, scATAC-seq provides a noisy and very sparse description of chromatin accessibility over the entire genome. Following prior studies, we generated five feature sets of scATAC-seq data, each of which addresses different biological questions40-42. These features are intended to summarize chromatin accessibility over different types of biologically relevant genomic intervals (for example, gene neighborhood), or represent dense low-dimensional embeddings of the original data43-45. An investigation of how feature choice affects observed perturbation magnitude is included in Supplemental Note Section 7.
The measures of sample quality vary significantly across datasets (Fig. 2b). The total number of cells per dataset is usually restricted by experimental limitations although it has increased over time. Total unique molecular identifier (UMI) count per cell and number of genes per cell are calculated as described elsewhere46. These values are used for quality control in data analysis. The average sequencing depth, that is, the mean number of reads per cell, in each study affects the number of low-expression genes observed. Increasing sequencing depth increases the UMI counts measured even for low-expression genes, reducing the uncertainty associated with zero counts34,47. The overall number of recoverable UMI counts, usually estimated by sequencing saturation, also depends on the quality of the experiment: increasing sequencing depth alone cannot cover for loss of messenger RNA due to degradation. These differences can affect the distinguishability of perturbations and the performance of downstream analysis.
To compare and evaluate the effect and strength of perturbations in each dataset we used the E-distance, a statistical measure of the distance between two distributions, which provides intuition about the signal-to-noise ratio in a dataset48. For two groups of cells, it relates the distribution of distances of cells between the groups (‘signal’), to the distribution of distances within each group ('noise'). More precisely, it compares the mean pairwise distance of cells between two different perturbations to the mean pairwise distance of cells within each of the two distributions (Fig. 3a; see Supplemental Note Section 4 for more detail). If the former is much larger than the latter, the two distributions are distinct. A low E-distance indicates that a perturbation did not induce a large shift in expression profiles, reflecting technical problems in the experiment, weak effect of the perturbation, or resistance to perturbation. Similar to related work20, we compute the E-distance after principal component analysis (PCA) for dimensionality reduction20. Analysis of robustness with respect to details of data processing is provided in Supplemental Note Section 3.
Fig. 3. E-statistics describe distinctiveness of perturbations in single-cell data.
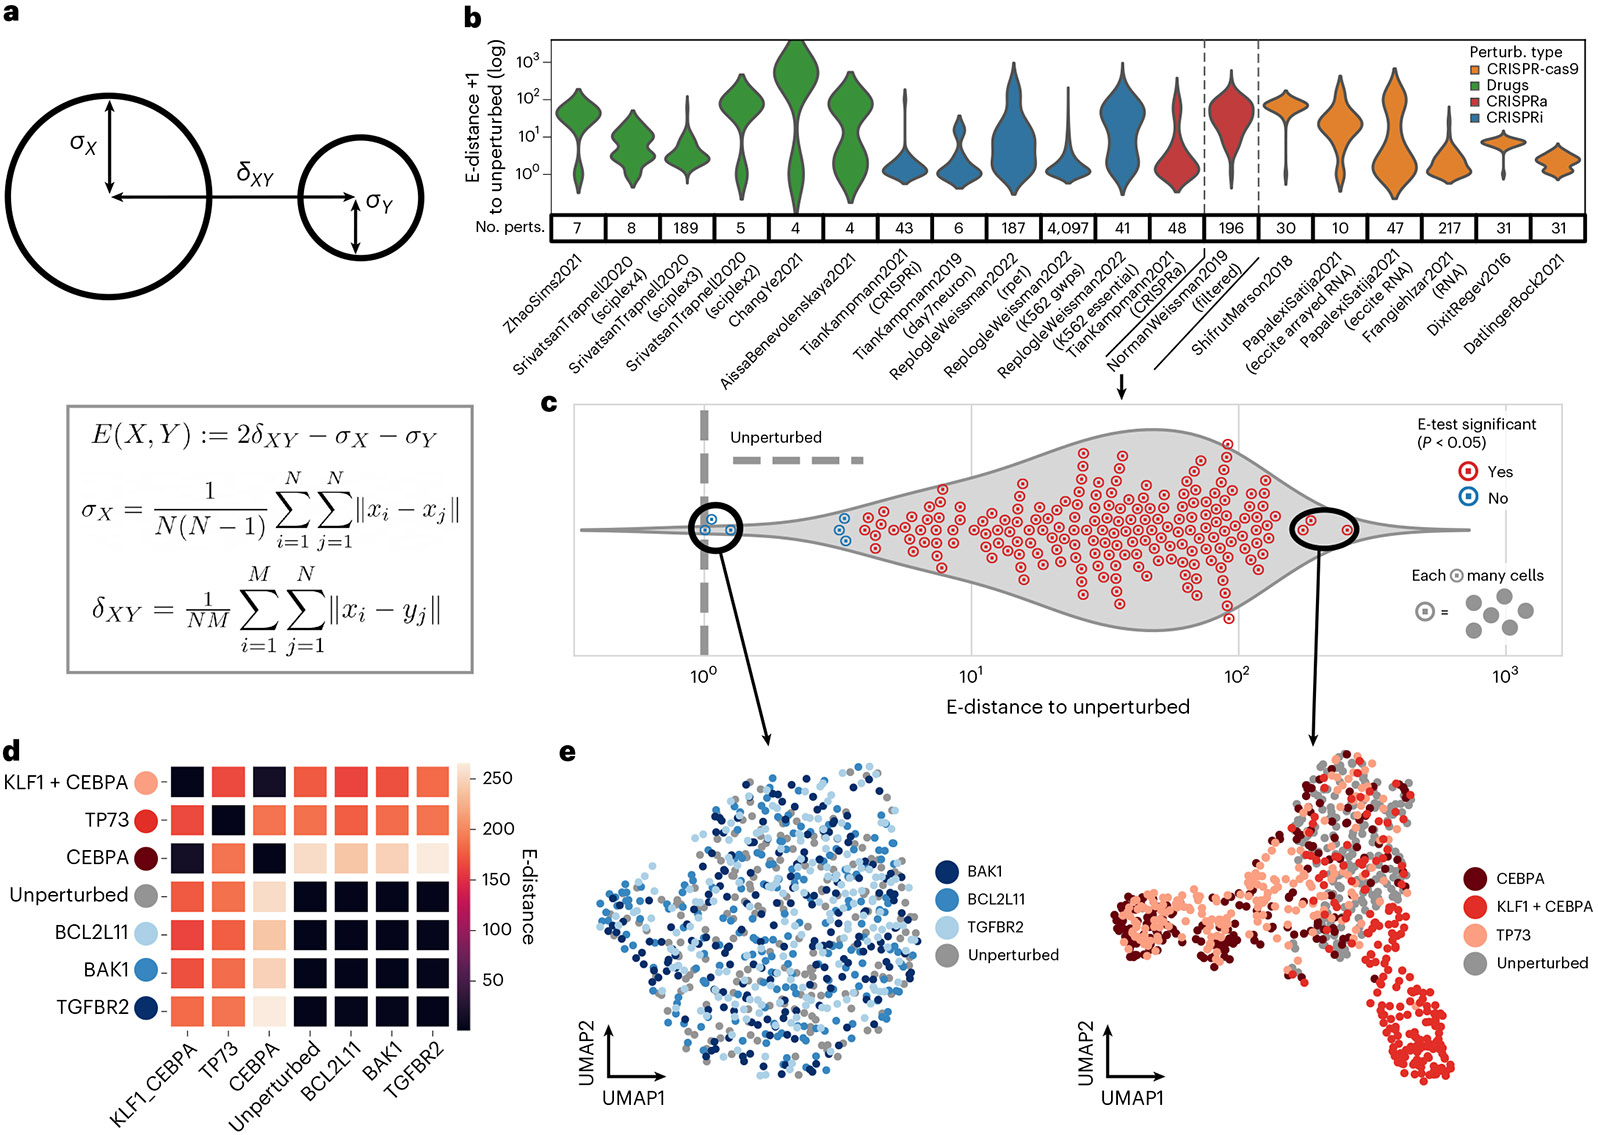
a, Definition of E-distance, relating the width of cell distributions of high-dimensional molecular profiles to their distance from each other (see Methods). A large E-distance of perturbed cells from unperturbed indicates a strong change in molecular profile induced by the perturbation. b, Distribution of E-distances (for log scale, same in c) between perturbed and unperturbed cells across datasets. No. perts, number of perturbations per dataset. Note that this plot is best used to compare the shape of the E-distance distribution rather than the magnitude; the mean E-distance will vary significantly with other dataset properties. c–e, Analysis based on E-statistics for one selected dataset49. c, Distribution of E-distances between perturbed and unperturbed cells as in b. Each circled point is a perturbation, that is, it represents a set of cell profiles. Each perturbation was tested for significant E-distance to unperturbed (E-test). Distances and P values for each perturbation are listed in Supplementary Table 3. d, Pairwise E-distance matrix across the top and bottom three perturbations in c and the unperturbed cells. e, UMAP of single cells of the weakest (left, bottom three) and strongest (right, top three) perturbations.
The E-distance can also be used as a test statistic to assess whether cells after a perturbation are significantly different from unperturbed cells (Supplementary Table 3). The assessment is performed using the E-test, a Monte Carlo permutation test that uses the E-distance as a test statistic48 (Methods). The exact value of the E-distance depends on dataset-specific parameters such as sequencing depth (Supplemental Note Section 4) and how exactly the cells are distributed; the E-test accounts for these differences by creating a null distribution using permutations of the data.
Interestingly, we found that E-distances between perturbed and unperturbed cells vary considerably across datasets (Fig. 3b). The dataset labeled 'NormanWeissman2019' had the largest mean E-distance between all perturbations49 compared with datasets of similar size. In fact, expression profiles of most perturbations in this dataset were significantly different from those of unperturbed cells according to the E-test (Fig. 3c). Plausibly, this is in part caused by two-target perturbations using CRISPRa in that dataset: targeting the same gene with two single guides increases the chances of causing a considerable change in the transcript profile. Indeed, the three perturbations with highest E-distance are double perturbations while the three with the lowest E-distance are not. The corresponding UMAPs (uniform manifold approximation and projections) for these perturbations, computed using the same principal components used for the E-distance, provide a confirmatory visual intuition for high and low E-distances (Fig. 3e). Cells in the top three perturbations with the largest E-distance to unperturbed cells are easily distinguishable from the gray unperturbed cells, while cells from the bottom three weakest perturbations are part of a single, uniform cloud visually indistinguishable from the unperturbed cells. This illustrates that the smallest E-distance results from perturbations that have the least effect on the distribution of cells.
The E-distance can also be used to quantify similarity between different perturbations. For instance, there is a clear overlap of CEBPA and KLF1 + CEBPA perturbed cells in the UMAP (Fig. 3e). This overlap is captured by a low E-distance: cells affected by these two perturbations are closer to each other than they are to unperturbed cells or to those from other perturbations (Fig. 3d and Supplementary Fig. 2a). We envision that the E-distance can be used as a suitable distance for other downstream tasks such as drug embeddings and clustering of perturbations, which could enable inference of functional similarity of perturbations by similarity in their induced molecular responses quantified by the E-distance.
As a detailed demonstration of the power of E-distance for analyzing perturbation datasets, we calculated pairwise E-distance between all pairs of perturbations in a dataset characterizing inhibitory immune checkpoints (Fig. 4). This study used CRISPR-cas9 to perturb genes encoding proteins involved in regulating programmed death-ligand (PD-L1) (ref. 9). Hierarchical clustering of the resulting distance matrix produced two distinct groups of perturbations. The perturbations in the group more dissimilar to the unperturbed condition have a low E-distance to each other, suggesting a similar phenotype induced by perturbation of these genes (IFNGR1, IFNGR2, JAK2, STAT1). Indeed, the proteins encoded by these genes are all reported to be part of a signaling cascade upstream of interferon regulatory factor 1 (IRF1) and downstream of interferon-γ (IFNγ; ref. 50). In agreement with this, we observe that any disruption of a gene in this cascade leads to a similar outcome and, therefore, a similar transcriptome profile.
Fig. 4. E-distance dissects perturbation hierarchy in data from Papalexi et al.9.
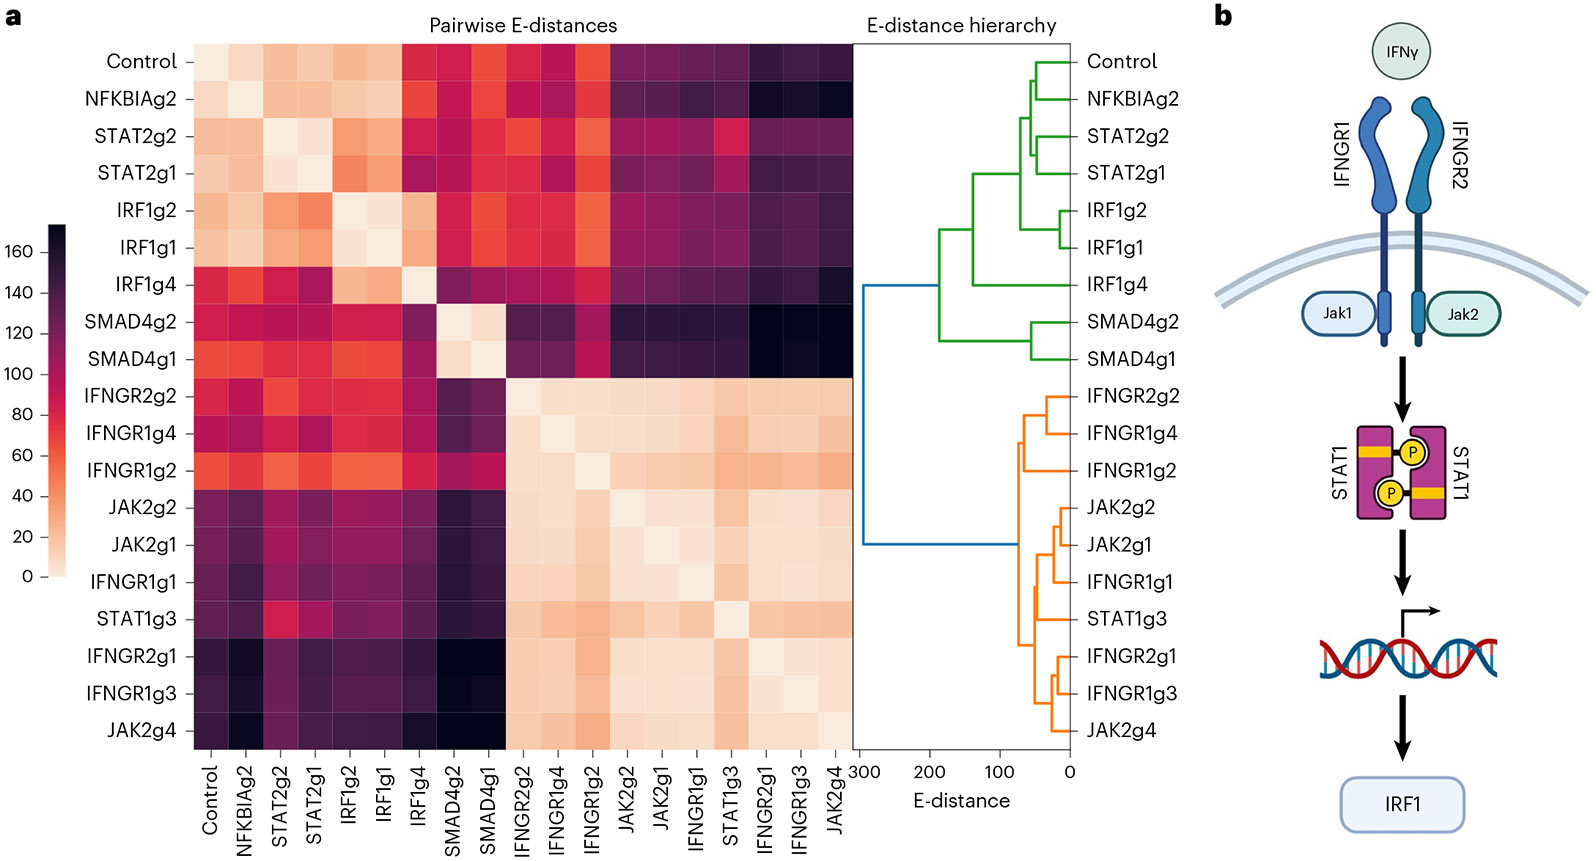
a, E-distance between cells of all pairs of perturbations in the Papalexi et al. dataset9. Hierarchical clustering of this matrix produces two groups, one that is more similar to unperturbed cells (green) and one that has a stronger transcriptional change (orange). b, Signaling pathway downstream of the IFNγ receptor. Permutations of nodes upstream of IRF1 induce similar phenotypes.
We investigate the robustness of E-distance and E-test scores to experimental and computational parameters using the scPerturb collection of annotation-harmonized single-cell perturbation datasets. We subsampled the number of cells per perturbation to create artificially smaller datasets, then examined how the E-distance and E-test results change. We introduce a bias correction to the E-distance that improves performance in low cell count regimes (Supplemental Note Section 1). We find that even after bias correction the E-distance increases as the number of cells per perturbation decreases, indicating that cells per perturbation should be standardized prior to calculating E-distances (Fig. 5a). This is due to the inability of PCA to adequately represent data in the low sample regime51. Despite the increase in E-distance with falling cell numbers, the number of significant perturbations correctly decreases with fewer cells, and only some datasets have saturated significance at the full number of cells in that dataset (Fig. 5b). This saturation point depends on perturbation strength and on dataset heterogeneity: if all cells are similar, a small set of cells will sufficiently describe every possible response to a perturbation. This suggests that, unsurprisingly, increasing sample size enables discovery of significant perturbations with smaller overall effects on transcripts.
Fig. 5. Effect of subsampling UMI counts per cell and number of cells per perturbation on E-statistics.
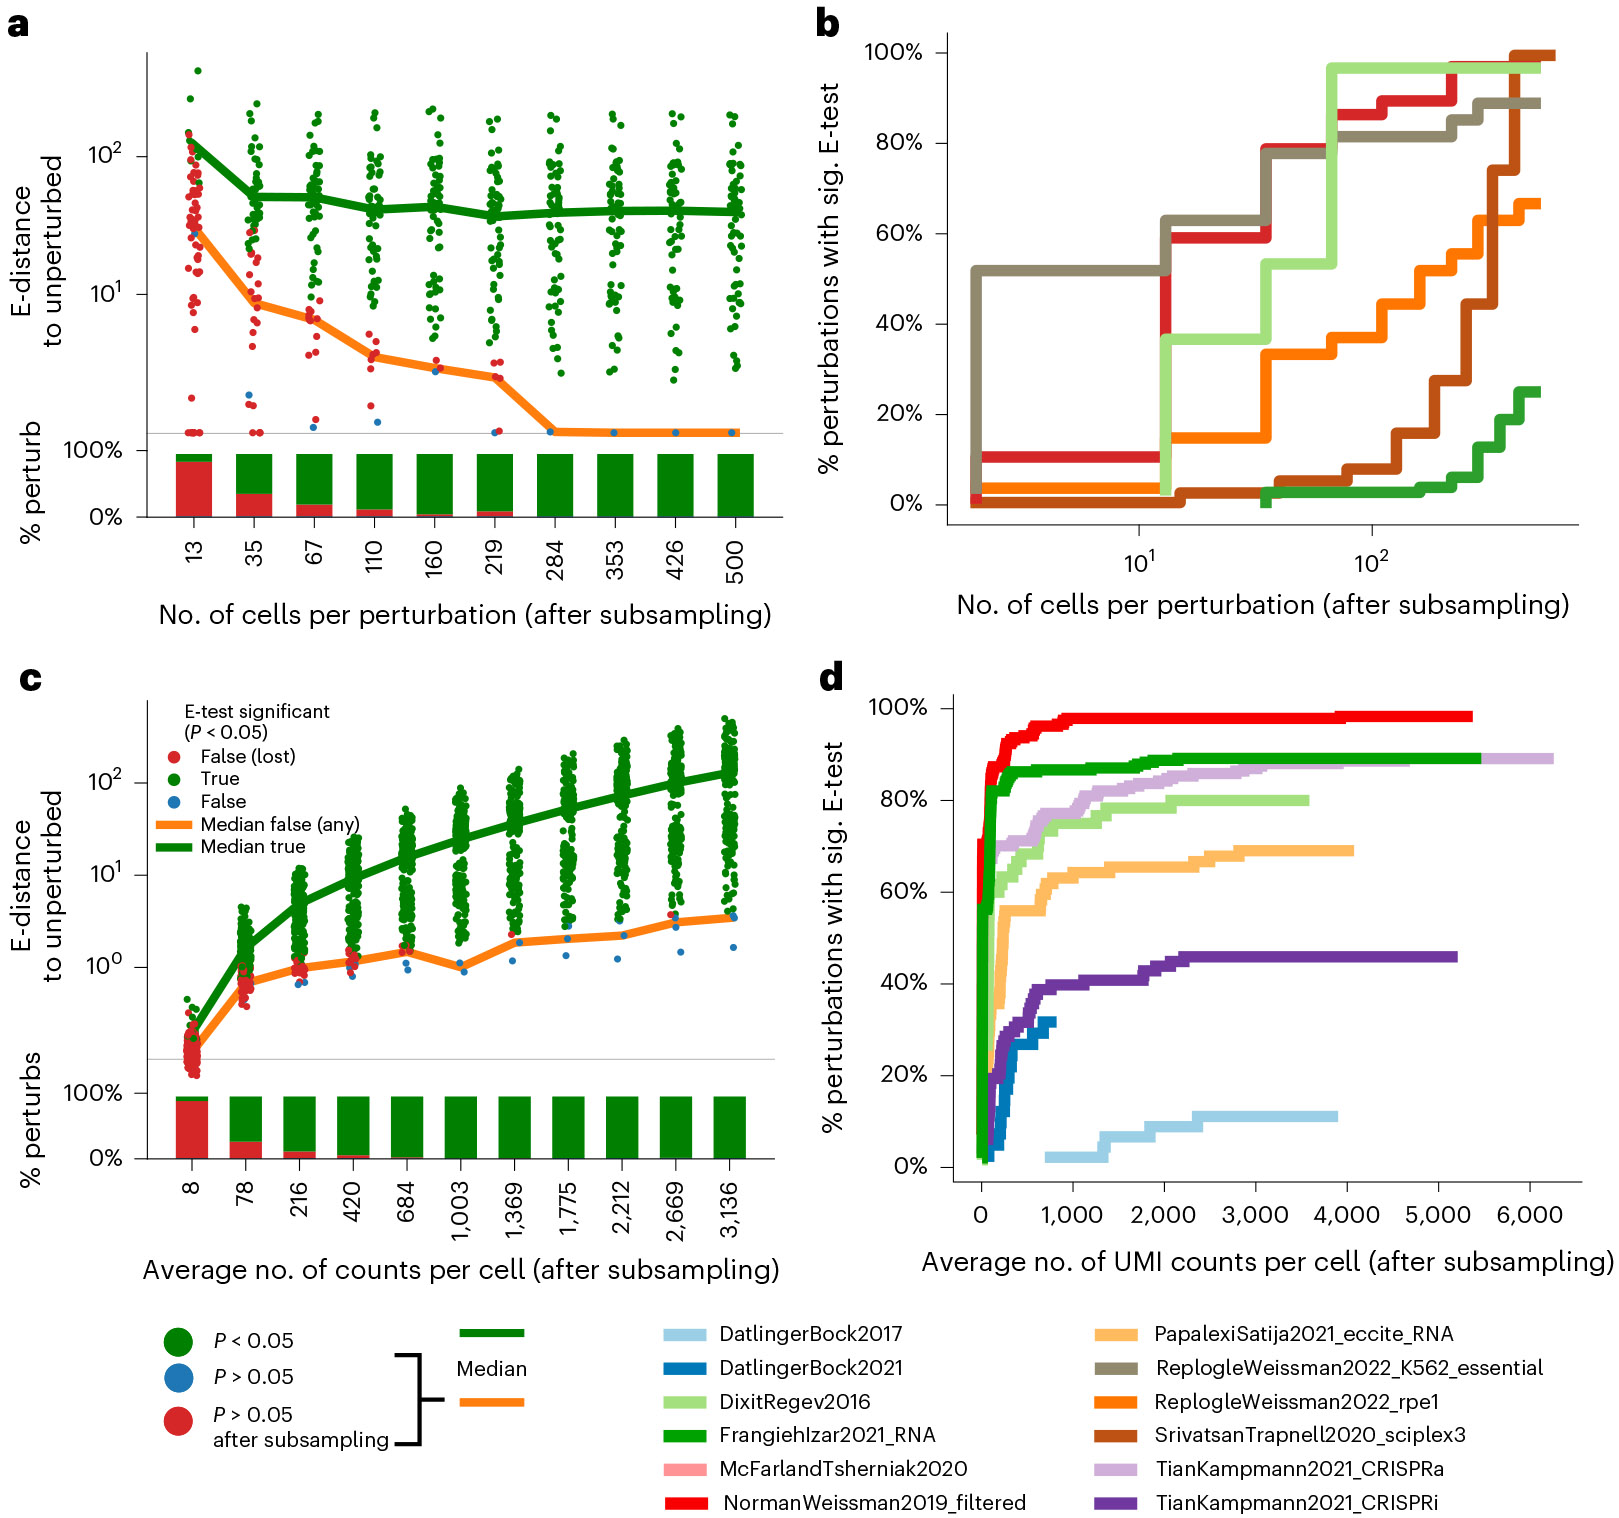
a, E-distance of each perturbation to unperturbed in the Norman et al. dataset49 while subsampling the number of cells per perturbation. Color indicates E-test results; ‘significance lost’: perturbation significant when all cells are considered, but not significant after subsampling. The E-test loses significance with lower cell numbers while the E-distance actually increases. b, The overall number of perturbations with significant (sig.) E-test decreases when subsampling cells per perturbation. c, As in a but subsampling UMI counts per cell while keeping the number of cells constant. E-test significance was lost and E-distance to unperturbed dropped as the overall signal deteriorated with removal of UMI counts. d, As in b but subsampling UMI counts per cell while keeping the number of cells constant.
Similarly, we subset the number of UMIs per cell, finding that E-distance increases as the UMI count per cell increases (Fig. 5c). The number of significant perturbations under the E-test, however, saturates at around 500 UMIs per cell, with most perturbations that were significant at the full measured read depth maintaining that significance even with far fewer counts per cell (Fig. 5d). The stability of E-test results with respect to UMI counts, in contrast to the actual E-distance value, demonstrates the necessity of the E-test, which uses a randomized control, as the appropriate statistical measure to evaluate the significance of perturbation effects. The optimal lower bounds on UMI and cell counts for a given experiment depend on downstream specific modeling tasks, as discussed in more detail elsewhere12. As a baseline for significant perturbations, as defined by the E-test, we suggest at least 200–500 cells per perturbation (Fig. 5b) and an average of 1,000 UMIs per cell (Fig. 5d) as an experimental guideline for distinguishable perturbations.
There are a few particularly notable datasets in the resource (Supplementary Fig. 2b). The most extensive drug dataset is sci-Plex 3, which includes 188 drugs tested across three cell lines52; 107 of those perturbations had significant effects on cell states according to E-test analysis (Supplementary Table 3). Five drugs in this dataset also appear in other drug perturbation datasets (Supplementary Table 4). We hope that future large-scale drug screens will enable more detailed analysis of drug response across different cell types and conditions. Another drug dataset applies combinations of three drug perturbations at varying concentrations across samples19. An example analysis of this dataset is in Supplemental Note Section 9. The most detailed CRISPR dataset is from a recently published study that carried out perturbation of 9,867 genes in human cells20. Containing >2.5 million cells, this dataset is the largest in our database, with the average number of cells, which each gene is detected in, being significantly higher than in other datasets. Notably, 138 CRISPR perturbations are seen in both RNA and ATAC datasets (Supplementary Table 5). More than 100 genes perturbed with CRISPRa in one dataset are perturbed with CRISPRi perturbations in another dataset of the same cell line, either in one publication21 or across multiple studies20,49. The most frequently perturbed gene, MYC, is perturbed in nine datasets from three publications. Protein, RNA and ATAC readouts for CRISPRi perturbation of MYC are all available for K562 cells6,20,42.
Discussion
We present a dataset resource and an intuitive method for quantifying and analyzing single-cell perturbation datasets. Processed cellular response data with added quality control metrics are available on scPerturb.org. The uniform annotations in this resource enable data integration and benchmarking as well as exploration of the effects of shared perturbations across datasets. We introduce a bias-corrected E-distance for quantitatively comparing perturbations. We also investigate the effect of dataset-specific parameters on E-statistics, showing that E-statistics stabilize above 1,000 counts per cell and 200–500 cells per perturbation.
Although this work simplifies dataset access, joint analysis is limited by the complexity of data integration27. Across the eight drug datasets examined in this study, only five chemical agents occurred in more than one dataset (Supplementary Table 4). Shared gene targets are found more often across the CRISPR datasets (Supplementary Table 5). However, different experimental designs result in various covariates that may need to be accounted for in statistical testing. For example, high multiplicity-of-infection CRISPR screens with multiple targets per cell can complicate the calculation of distances5,53,54. In general, covariates arising from different experimental designs can affect the E-distance, and we recommend balancing cell numbers across experimental conditions if in doubt (Supplemental Note Section 8). Looking forward, this collection of datasets can be used to test data integration methods for perturbation biology, and it provides a unique opportunity to integrate datasets with overlapping perturbations and nominate machine learning benchmarks for data integration.
Lack of standardization in data sharing and processing across different research groups and studies hampered the creation of this resource. Although many processed datasets were available on the National Center for Biotechnology Information (NCBI) Gene Expression Omnibus (GEO)55, there is no standard format for sharing CRISPR barcode assignments and other metadata. Starting the analysis from sequencing reads may have improved the interoperability of datasets in this resource, but guide assignment procedures and demultiplexing algorithms are experimental set-up specific. For scATAC, data comparison is hindered by the lack of a standard method for feature assignment (Methods and Supplemental Note Section 7). In particular, for scATAC feature assignments specific to CRISPR perturbations, known loci of action could be used to improve feature calls40. For all data types, many datasets supplied only processed data, or raw data were available only after institutional clearance. Adding more datasets to this resource, or the creation of similar resources in the future, would be easier if there were standard formats for sharing perturbation data, and, more generally, standard formats for sharing single-cell annotations. While this report can provide some guidance, a community-wide discussion on standardization of such data is urgently needed, as was done for proteomic data56.
Such a standardization effort would enable simpler addition of datasets to the resource. Until universal standards are established, we encourage data creators to format their data following the guidelines in Supplementary Table 2 and contact the authors, for example, via the scPerturb website or associated GitHub repository, for inclusion. We anticipate that recent technological advances will decrease experimental costs and result in more new datasets, with additional experiment-specific analysis methods needed to convert from new highly multiplexed readouts into a standardized format53. The existing scPerturb database will be available archivally via Zenodo (see Data Availability), and we are committed to maintaining the resource with additional datasets for at least 3–4 years.
Beyond that timeline, it is difficult to predict what forms of data will be of primary interest to the community. At present, the resource consists predominantly of unimodal scRNA-seq data (Fig. 2a). The relatively smaller inclusion of scATAC-seq and other data types limits the resource’s utility for researchers working in epigenomics and gene regulation. Moreover, there is increasing interest in spatial techniques, including single-cell resolution spatial transcriptomics, epigenomics and proteomics57. The sharing of spatial data is hampered by large file sizes and non-standardized analysis pipelines58. A broader effort such as scPerturb might be needed in the future to specifically address the complexity of annotation-harmonizing spatial datasets.
Experiment design choices, such as the optimal number of cells per perturbation and the sequencing depth for each cell, depend on the questions that a particular perturbation study is intended to answer, and on the strength and uniqueness of the gene expression changes caused by the perturbations. Unfortunately, it is difficult to ascertain to what extent low E-distances between perturbed and unperturbed cells are caused by technical noise or simply weak perturbation effects compared with biological variation in groups of cells before and after perturbation. Increasing the dose or varying the time between perturbation start and collection of the cells may be advisable to increase the signal-to-noise ratio without sequencing more cells. For perturbation distinguishability as defined by the E-test, regardless of experiment parameters, we recommend measuring at least 200–500 cells per perturbation and an average of 1,000 UMIs per cell.
We envision that the scPerturb collection of datasets and the suggested E-statistics analytic framework will be valuable starting points for analysis of single-cell perturbation data. The unified annotations and perturbation significance testing should prove especially useful to the machine learning community for training computational models on this data. We expect that additional datasets and experimental perturbation methods in the future will enable the community to develop computational approaches to exploit the richness of single-cell perturbation data, aiming at the development of increasingly accurate and quantitatively predictive models of cell biological processes and the design of targeted interventions for investigational or therapeutic purposes.
Methods
scATAC-seq
Data acquisition.
We included scATAC-seq data from three different sources: Spear-ATAC42, CRISPR-sciATAC59 and ASAP-seq39. All data that were used in our analysis can be programmatically downloaded with scripts that are provided in our code repository (https://github.com/sanderlab/scPerturb).
scATAC-seq is a biomolecular technique to assess chromatin accessibility in single cells43,44. The starting point of our data processing pipeline is BED-like tabular fragment files, in which each line represents a unique ATAC-seq fragment captured by the assay. Each fragment is mapped to a genomic interval and a cell barcode. The goal of our pipeline is to extract standardized features from this information. Those are: embeddings derived from latent-semantic-indexing (LSI)44 with 30 dimensions for each cell (a dimensionality reduction method that is well-suited to the sparsity of the data); gene scores that measure the chromatin accessibility around each gene for each cell (the weighted sum of fragment counts around the neighborhood of a gene’s transcription start site, where more distant counts contribute less); a peak–barcode matrix that quantifies the chromatin accessibility at (dataset-specific) consensus peaks (genomic intervals) for each cell; chromVAR scores45, which quantify the activity of a set of transcription factors for each cell, using transcription factor footprints as defined in ref. 60; and marker-peaks per perturbation target, which quantifies the differential regulation of highly variable peaks for each type of perturbation.
These features were computed using the ArchR framework v1.0.1 (ref. 41) with standard parameters unless otherwise stated. We provide each feature set as a dedicated h5ad file on scperturb.org, and our analysis mostly follows the pipeline proposed in Spear-ATAC42, as detailed below.
Note that these features were originally developed for scATAC-seq data on non-perturbed cells, with goals such as the identification of cell type, discovery of cell type-specific regulatory elements, or reconstruction of cellular differentiation trajectories43,61.
Pre-processing.
Filtering of low-quality cells. To ensure a consistent and homogenous quality throughout the different datasets, we filtered out cells with fewer than 1,000 and more than 100,000 mapped fragments. Furthermore, we required a minimum transcription start site enrichment score of 4 to ensure a sufficient signal-to-noise ratio. See the createArrowFile function in ArchR for details.
For the Spear-ATAC dataset we ran ArchR’s getValidBarcodes function on processed 10x Cell Ranger files to subset the dataset to valid barcodes. For the other datasets these files were unavailable, and we relied on the original authors’ pre-processing of barcodes.
Assignment of single-guide RNAs to barcodes.
For the Spear-ATAC42 and CRISPR_sciATAC59 datasets we had access to cell barcode–sgRNA count matrices (see original publications for details). We assigned the sgRNA with the highest counts to a cell barcode if the sgRNA count exceeded 20 and if that sgRNA comprised at least 80% of all sgRNA counts. Cells that could not be assigned an sgRNA were left in the dataset. For the ASAP-seq dataset a barcode–sgRNA matrix was not available. Instead, we relied on an sgRNA assignment downloaded from the study’s GitHub repository32.
Feature computation.
All features described in the overview above were computed with ArchR functions. For details see the fragments2outputs.R script in our code repository, in the Data Availability section.
scRNA-seq
Data acquisition.
Datasets were downloaded from public databases following data availability directions in the source papers. When available from the authors, unnormalized preprocessed cell-by-gene matrices were used. Supplemental information from the papers were used in data analysis when applicable.
Data processing.
Analysis was initiated using unfiltered, unnormalized cell-by-gene matrices as provided by source papers. For one dataset, preprocessed cell-by-gene matrices were unavailable; pre-processing was performed following the procedure outlined in the original paper, directly using supplied code19. For datasets with cell barcodes, barcode assignments for cells were taken from the original paper when available; when not available, barcode assignment was performed as described in the methods section of the relevant paper. If multiple guides were assigned to the same cell, the guides were listed in decreasing order of counts in the final data object. The code used to process each individual dataset, including barcode assignment, is available in our code repository.
Datasets were imported into AnnData objects using Scanpy (v1.7.2–1.9.1)62. Metadata were taken from the original papers when available. For cell lines, information on sex, age, disease and origin were taken from Cellosaurus63. Metadata columns are described in Supplementary Table 2. Items listed in bold are included for all datasets.
Datasets are stored as .h5ad files. Code is supplied in our code repository for the import of .mtx files into Seurat.
Data analysis.
Before calculating the E-distances (Fig. 4), cells and genes were filtered using Scanpy (v1.7.2–1.9.1)62. All .h5ad objects published on the resource were saved using Scanpy v1.9.1. Cells were retained if they had a minimum of 1,000 UMIs, and genes, with a minimum of 50 cells. A total of 2,000 highly variable genes were selected using scanpy.pp.find_variable_genes with flavor seurat_v3. We normalized the count matrix using scanpy.pp.normalize_total and log-transformed the data using scanpy.pp.log1p; we did not z-scale the data. Next, we computed PCA based on the highly variable genes. The E-distances were computed in that PCA space using 50 components and Euclidean distance. To avoid problems due to different numbers of cells per perturbation, we subsampled each dataset such that all perturbations had the same number of cells. We removed all perturbations with fewer than 50 cells and then subsampled to the number of cells in the smallest perturbation left after filtering. Large parts of our analysis were parallelized as workflows using Snakemake64. For applications of E-distance to datasets with confounding factors such as batch effect, we recommend correcting for these factors prior to PCA.
E-distance.
The E-distance is a statistical distance between high-dimensional distributions and has been used to define a multivariate two-sample test, called the energy test (E-test)65. It is more commonly known as energy distance, stemming from the original interpretation using gravitational energy in physics. Formally, it contextualizes the notion that two distributions of points in a high-dimensional space are distinguishable if they are far apart compared with the width of both distributions (Fig. 3a). More specifically,
Let and be samples from two distributions , , corresponding to two sets of and cells, respectively.
We define
and defined accordingly. We used the squared Euclidean distance when calculating cell-wise distances. Intuitively, is the mean distance between cells from the two distributions, while describes the mean distance between a cell from to another cell from . The energy distance between and is defined as:
For the bias-corrected energy distance, described in detail in the Supplemental Note, we define
With the exception of the calculations for Fig. 5c and Fig. 5d, which use the standard E-distance, all calculations use the bias-corrected form of the E-distance.
E-test calculation.
The E-test was performed as a Monte Carlo permutation test using E-distance as the test statistic. For each dataset and each perturbation in that dataset, we took the cells and combined them with the unperturbed cells. Then, we shuffled the perturbation labels and computed the E-distance between the two resulting groups. We repeated this process 10,000 times. The number of times that this shuffled E-distance to the unperturbed group was larger than the unshuffled E-distance, divided by 10,000, yields a p-value corresponding to a one-sided test of difference, which we report for almost all datasets in our resource (Supplementary Table 3). We corrected for multiple testing using the Holm–Sidak method per dataset.
Subsampling analysis.
At each subsampling point we computed detailed E-statistics (E-distances, delta, sigma, E-test results) for the E-distance from each perturbation to the corresponding unperturbed cells of that dataset using PCA with 50 components based on 2,000 highly variable genes, except when specified otherwise. We downsampled raw UMI counts using the function scanpy.pp.downsample_counts on raw counts, then preprocessed (normalized, log1p-transformed, and so on) the data as previously described. Cells were downsampled to the same number at each subsampling step across all perturbations to avoid comparability issues. If possible, we recalculated the PCA while keeping the highly variable genes originally obtained from the complete dataset. Figure 5c,d was computed as a running loss of E-test significance (p < 0.05) of formerly (that is, prior to any subsampling) significant perturbations while subsampling, then normalized across datasets through division by the total number of formally significant perturbations in that dataset.
Advice for single-cell perturbation analysis.
Resource users should be aware that memory requirements quickly become a limiting factor, especially with the newer, larger datasets, such as ReplogleWeissman2022 with >2.5 million cells across more than 9,000 perturbations20. For example, the E-distance presented here for calculating distances between perturbed sets of cells relies on PCA, but computing PCA for all data in this dataset was not possible with 500 GB of memory without modifications to accelerate computation. In future, computational methods will need to be modified as in ref. 66 to reduce memory load, or datasets will need to be subsampled. Additionally, the .h5ad datasets shared in this resource can be programmatically accessed using .h5py, and perturbations of interest extracted without requiring full dataset access.
To our knowledge, best practices have not yet been established for analysis of single-cell perturbation data. DESeq2 is frequently used for differential expression testing, given that it can be applied to pseudo-bulk profiles of each perturbation67. An optional next step would be enrichment analysis of the resulting genes. Averaging single-cell measurements over cells per perturbation simplifies analysis and reduces the effect of measurement noise significantly but comes at the cost of removing all system-intrinsic biologically relevant information in cell-to-cell variation. In many studies, these average profiles are then embedded using a dimensionality reduction method of choice and subsequently clustered to identify groups of perturbations with potentially similar targets20,49.
Extended Data
Extended Data Fig. 1. Number of cells per dataset by submission date.
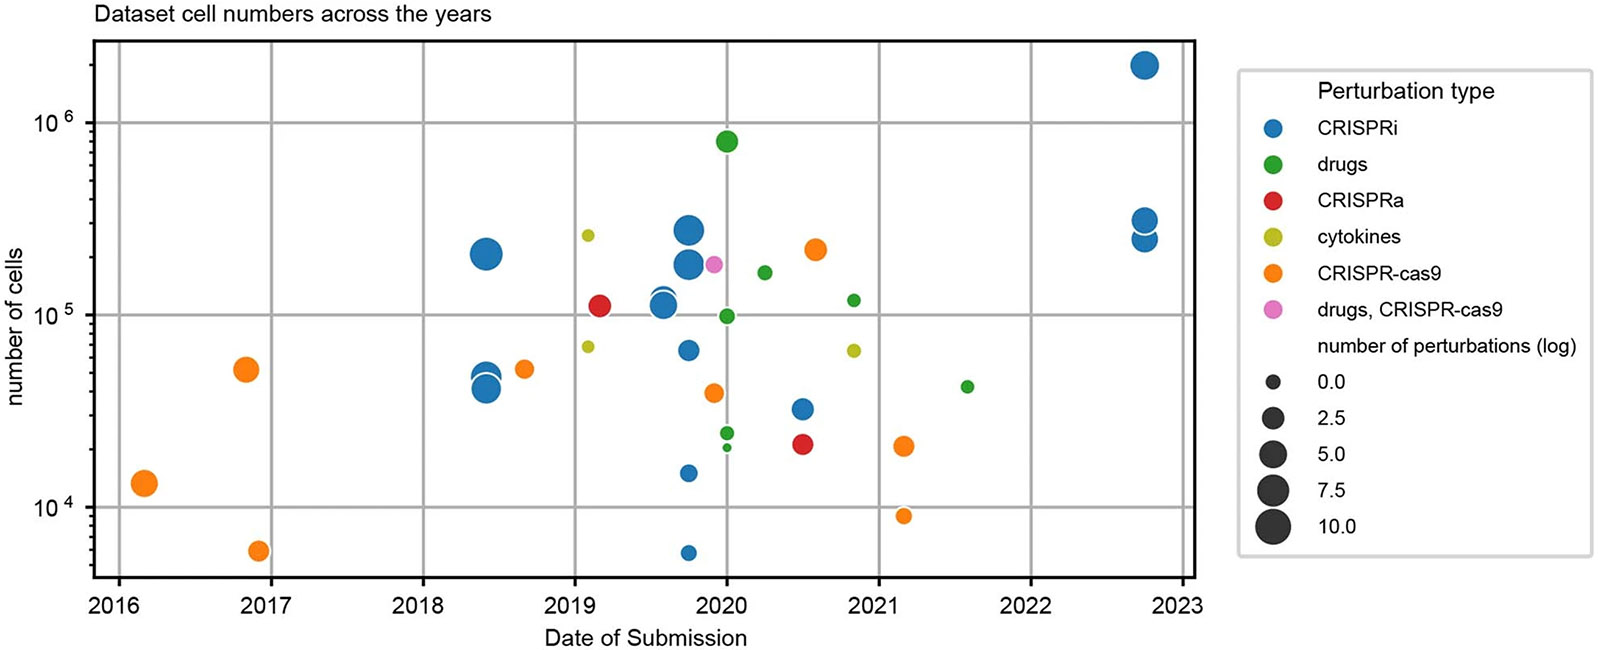
There is a rapid increase in published single-cell perturbation datasets around 2019. We speculate that the slight decrease of dataset numbers after 2021 suggested by the plot is due to the ongoing impact of reduced research in the earlier phases of the COVID-19 pandemic.
Extended Data Fig. 2. Harmonization and analysis workflow.
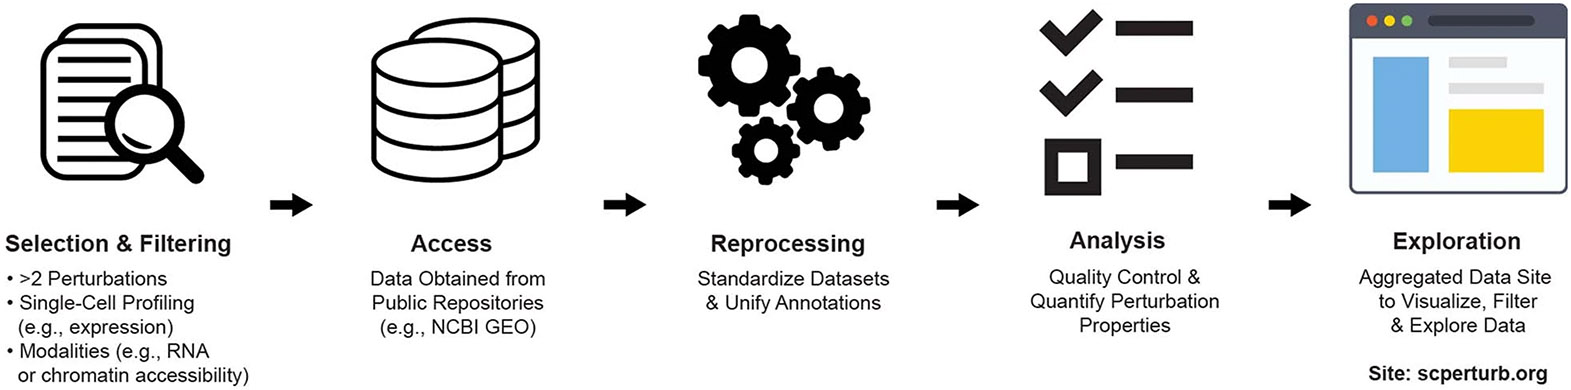
Perturbation datasets with single-cell molecular profiles with at least two perturbations and one control condition (for example unperturbed) of various modality types were identified in a literature search. Data were obtained from public repositories, and metadata (such as guide identity) from paper supplements. Datasets were reprocessed to standardize annotations and analyzed in parallel. All datasets are now available for download from scperturb.org, along with visualizations and summarizing information.
Extended Data Fig. 3. Pairwise E-distances for NormanWeissman2019 dataset.
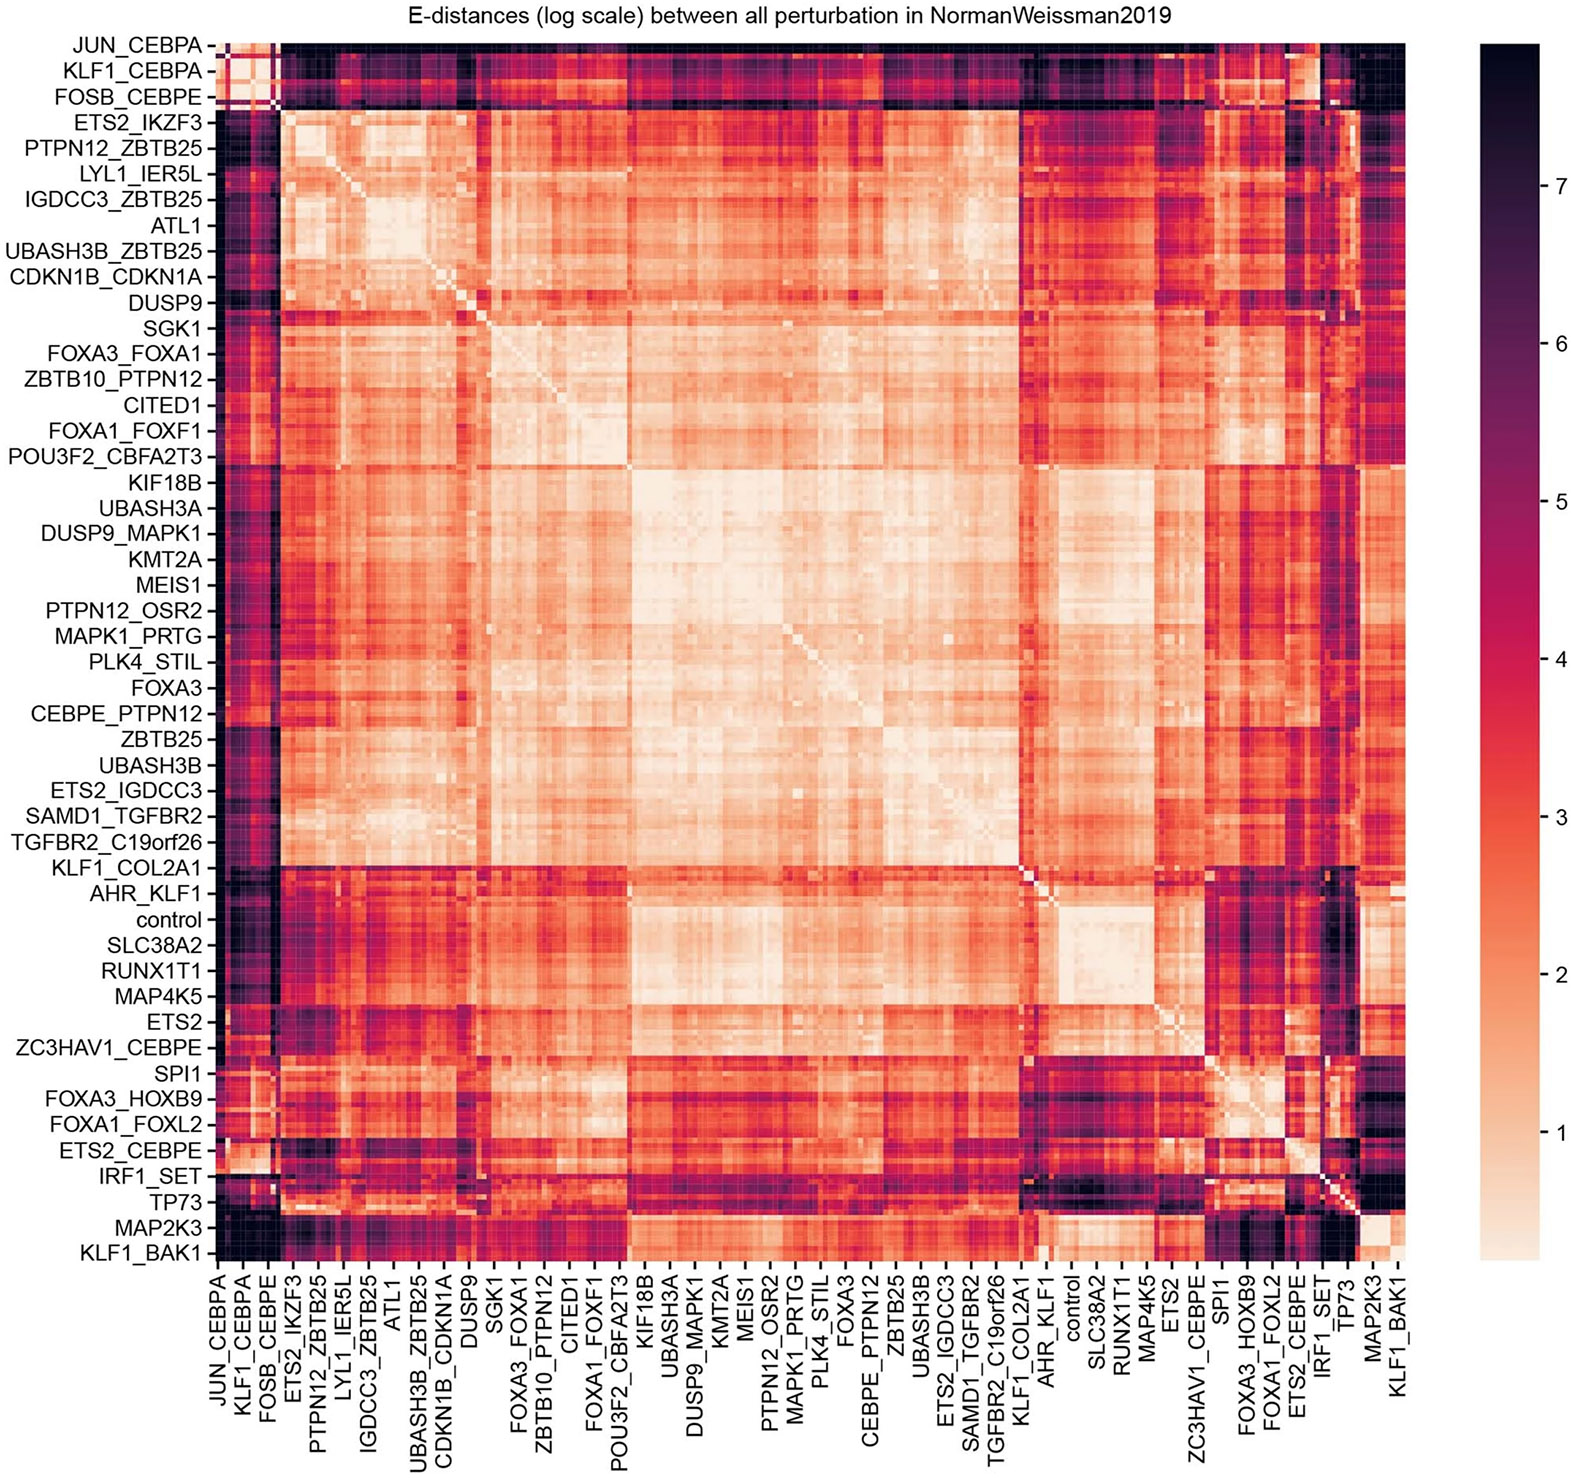
E-distances between all pairs of perturbations in the dataset NormanWeissman2019. The color scale is clipped at 5% highest and lowest percentiles. Clusters of similar perturbations are visible, for example a cluster of strongly acting perturbations targeting CEBPA at the top.
Supplementary Material
The online version contains supplementary material available at https://doi.org/10.1038/s41592-023-02144-y.
Acknowledgements
The authors appreciate informative conversations with Y. Ji of the Fabian Theis laboratory, helpful code suggestions from G. Wong, and computational support from A. Kollasch of the Debora Marks laboratory. The authors also appreciate preprint review comments from Arcadia Science’s preprint review initiative (G. P. Way, N. Davidson, E. Serrano, P. Hicks, J. Tomkinson, D. Bunten). This work was supported by the National Resource for Network Biology (NRNB, P41GM103504 to C.Sa.), the Wellcome Leap ΔTissue Program (to C.Sa., L.J.S., D.S.M.), the Deutsche Forschungsgemeinschaft (DFG, RTG2424 CompCancer to N.B.), Einstein Stiftung Berlin (Einstein Visiting Fellow program, to C.Sa., N.B.), and the Intramural Research Program of the National Library of Medicine, National Institutes of Health (to A.L.). Computation was in part performed on the HPC for Research cluster of the Berlin Institute of Health. Figures 1 and 4b were created with BioRender.com.
Footnotes
Online content
Any methods, additional references, Nature Portfolio reporting summaries, source data, extended data, supplementary information, acknowledgements, peer review information; details of author contributions and competing interests; and statements of data and code availability are available at https://doi.org/10.1038/s41592-023-02144-y.
Reporting summary
Further information on research design is available in the Nature Portfolio Reporting Summary linked to this article.
Competing interests
J.P.T.-K. and T.G. are employees of Relation Therapeutics. C.Sa. is on the science advisory board of Cytoreason Ltd. D.S.M. serves as an advisor for Dyno Therapeutics, Octant, Jura Bio, Tectonic Therapeutic, and Genentech, and is a co-founder of Seismic Therapeutic. All other authors have no competing interests.
Extended data are available for this paper at https://doi.org/10.1038/s41592-023-02144-y.
Data availability
The website scperturb.org stores harmonized datasets with the following: scRNA-seq and antibody-based protein datasets: .h5ad files; scATAC-seq: multiple different feature matrix definitions as separate download options. RNA data at https://doi.org/10.5281/zenodo.7041848 and ATAC data at https://doi.org/10.5281/zenodo.7058381. Dataset access details: AdamsonWeissman20167: GSE90546 on GEO55; AissaBenevolenskaya202168: GSE149383 on GEO; ChangYe202169: E-MTAB-10698 on ArrayExpress70; DatlingerBock20171: GSE92872 on GEO; DatlingerBock202171: GSE168620 on GEO; DixitRegev20162: GSE90063 on GEO; FrangiehIzar20216: SCP1064 on the Broad Single Cell Portal https://singlecell.broadinstitute.org/single_cell/study/SCP1064/multi-modal-pooled-perturb-cite-seq-screens-in-patient-models-define-novel-mechanisms-of-cancer-immune-evasion; GasperiniShendure201954: GSE120861 on GEO; GehringPachter201919: https://doi.org/10.22002/D1.1311 on CaltechDATA; Liscovitch-BrauerSanjana202159: GSE161002 on GEO; McFarlandTsherniak202072: https://doi.org/10.6084/m9.figshare.5863776.v1 on figshare; MimitouSmibert202173: GSE156476 on GEO; NormanWeissman201949: GSE133344 on GEO; PapalexiSatija2029: GSE153056 on GEO; PierceGreenleaf202142: data deposited on AWS, URIs to be found at https://www.ncbi.nlm.nih.gov/pmc/articles/PMC8137922/bin/41467_2021_23213_MOESM9_ESM.xlsx; ReplogleWeissman202220: processed single-cell data from gwps.wi.mit.edu; Schiebinger-Lander201923: GSE106340 and GSE115943 on GEO; SchraivogelSteinmetz202074: GSE135497 on GEO; ShifrutMarson201875: GSE119450 on GEO; SrivatsanTrapnell202052: GSE139944 on GEO; TianKampmann201976: GSE152988 on GEO with mappings from kampmannlab.ucsf.edu/crop-seq; TianKampmann202121: GSE124703 on GEO; WeinrebKlein202077: GSE140802 on GEO; XieHon201778: GSE81884 on GEO; ZhaoSims202179: GSE148842 on GEO.
Code availability
Open access source code is at https://github.com/sanderlab/scPerturb/. We compiled a corresponding Python package called scperturb for performing E-statistics (E-distance and E-testing) in single-cell data, published on PyPI under https://pypi.org/project/scperturb/. Access details for the original publication for each dataset are available in the scPerturb GitHub repository (https://github.com/sanderlab/scPerturb) in the subfolder 'dataset_processing'.
References
- 1.Datlinger P. et al. Pooled CRISPR screening with single-cell transcriptome readout. Nat. Methods 14, 297–301 (2017). [DOI] [PMC free article] [PubMed] [Google Scholar]
- 2.Dixit A, Parnas O, Li B & Chen J. Perturb-seq: dissecting molecular circuits with scalable single-cell RNA profiling of pooled genetic screens. Cell 167, 1853–1866 (2016). [DOI] [PMC free article] [PubMed] [Google Scholar]
- 3.Jaitin DA et al. Dissecting immune circuits by linking CRISPR-pooled screens with single-cell RNA-seq. Cell 167, 1883–1896 (2016). [DOI] [PubMed] [Google Scholar]
- 4.Gilbert LA et al. Genome-scale CRISPR-mediated control of gene repression and activation. Cell 159, 647–661 (2014). [DOI] [PMC free article] [PubMed] [Google Scholar]
- 5.Wessels H-H et al. Efficient combinatorial targeting of RNA transcripts in single cells with Cas13 RNA Perturb-seq. Nat. Methods 20, 86–94 (2023). [DOI] [PMC free article] [PubMed] [Google Scholar]
- 6.Frangieh CJ et al. Multimodal pooled Perturb-CITE-seq screens in patient models define mechanisms of cancer immune evasion. Nat. Genet 53, 332–341 (2021). [DOI] [PMC free article] [PubMed] [Google Scholar]
- 7.Adamson B. et al. A multiplexed single-cell CRISPR screening platform enables systematic dissection of the unfolded protein response. Cell 167, 1867–1882 (2016). [DOI] [PMC free article] [PubMed] [Google Scholar]
- 8.Rubin AJ et al. Coupled single-cell CRISPR screening and epigenomic profiling reveals causal gene regulatory networks. Cell 176, 361–376 (2019). [DOI] [PMC free article] [PubMed] [Google Scholar]
- 9.Papalexi E. et al. Characterizing the molecular regulation of inhibitory immune checkpoints with multimodal single-cell screens. Nat. Genet 53, 322–331 (2021). [DOI] [PMC free article] [PubMed] [Google Scholar]
- 10.Gross T, Wongchenko MJ, Yan Y & Blüthgen N. Robust network inference using response logic. Bioinformatics 35, i634–i642 (2019). [DOI] [PMC free article] [PubMed] [Google Scholar]
- 11.Pratapa A, Jalihal AP, Law JN, Bharadwaj A & Murali TM. Benchmarking algorithms for gene regulatory network inference from single-cell transcriptomic data. Nat. Methods 17, 147–154 (2020). [DOI] [PMC free article] [PubMed] [Google Scholar]
- 12.Gross T & Blüthgen N. Identifiability and experimental design in perturbation studies. Bioinformatics 36, i482–i489 (2020). [DOI] [PMC free article] [PubMed] [Google Scholar]
- 13.Bertin P. et al. RECOVER: sequential model optimization platform for combination drug repurposing identifies novel synergistic compounds in vitro. Preprint at 10.48550/arXiv.2202.04202 (2022). [DOI] [Google Scholar]
- 14.Franz A. et al. Molecular response to PARP1 inhibition in ovarian cancer cells as determined by mass spectrometry based proteomics. J. Ovarian Res 14, 140 (2021). [DOI] [PMC free article] [PubMed] [Google Scholar]
- 15.Preuer K. et al. DeepSynergy: predicting anti-cancer drug synergy with deep learning. Bioinformatics 34, 1538–1546 (2018). [DOI] [PMC free article] [PubMed] [Google Scholar]
- 16.Kharchenko PV. The triumphs and limitations of computational methods for scRNA-seq. Nat. Methods 18, 723–732 (2021). [DOI] [PubMed] [Google Scholar]
- 17.Burkhardt DB et al. Quantifying the effect of experimental perturbations at single-cell resolution. Nat. Biotechnol 39, 619–629 (2021). [DOI] [PMC free article] [PubMed] [Google Scholar]
- 18.Dann E, Henderson NC, Teichmann SA, Morgan MD & Marioni JC. Differential abundance testing on single-cell data using k-nearest neighbor graphs. Nat. Biotechnol 40, 245–253 (2022). [DOI] [PMC free article] [PubMed] [Google Scholar]
- 19.Gehring J, Park JH, Chen S, Thomson M & Pachter L. Highly multiplexed single-cell RNA-seq by DNA oligonucleotide tagging of cellular proteins. Nat. Biotechnol 38, 35–38 (2020). [DOI] [PubMed] [Google Scholar]
- 20.Replogle JM et al. Mapping information-rich genotype–phenotype landscapes with genome-scale Perturb-seq. Cell 185, 2559–2575 (2022). [DOI] [PMC free article] [PubMed] [Google Scholar]
- 21.Tian R. et al. Genome-wide CRISPRi/a screens in human neurons link lysosomal failure to ferroptosis. Nat. Neurosci 24, 1020–1034 (2021). [DOI] [PMC free article] [PubMed] [Google Scholar]
- 22.Chen WS et al. Uncovering axes of variation among single-cell cancer specimens. Nat. Methods 17, 302–310 (2020). [DOI] [PMC free article] [PubMed] [Google Scholar]
- 23.Schiebinger G. et al. Optimal-transport analysis of single-cell gene expression identifies developmental trajectories in reprogramming. Cell 176, 928–943 (2019). [DOI] [PMC free article] [PubMed] [Google Scholar]
- 24.Lotfollahi M, Naghipourfar M, Theis FJ & Wolf FA. Conditional out-of-distribution generation for unpaired data using transfer VAE. Bioinformatics 36, i610–i617 (2020). [DOI] [PubMed] [Google Scholar]
- 25.Przybyla L & Gilbert LA. A new era in functional genomics screens. Nat. Rev. Genet 23, 89–103 (2022). [DOI] [PubMed] [Google Scholar]
- 26.Forcato M, Romano O & Bicciato S. Computational methods for the integrative analysis of single-cell data. Brief. Bioinform 22, 20–29 (2021). [DOI] [PMC free article] [PubMed] [Google Scholar]
- 27.Luecken MD et al. Benchmarking atlas-level data integration in single-cell genomics. Nat. Methods 19, 41–50 (2022). [DOI] [PMC free article] [PubMed] [Google Scholar]
- 28.Duan B. et al. Model-based understanding of single-cell CRISPR screening. Nat. Commun 10, 2233 (2019). [DOI] [PMC free article] [PubMed] [Google Scholar]
- 29.Jin K. et al. CellDrift: inferring perturbation responses in temporally-sampled single cell data. Brief. Bioinform 23, bbac324 (2022). [DOI] [PMC free article] [PubMed] [Google Scholar]
- 30.Lotfollahi M, Wolf FA & Theis FJ. scGen predicts single-cell perturbation responses. Nat. Methods 16, 715–721 (2019). [DOI] [PubMed] [Google Scholar]
- 31.Stathias V. et al. LINCS Data Portal 2.0: next generation access point for perturbation–response signatures. Nucleic Acids Res. 48, D431–D439 (2020). [DOI] [PMC free article] [PubMed] [Google Scholar]
- 32.Tsherniak A. et al. Defining a cancer dependency map. Cell 170, 564–576 (2017). [DOI] [PMC free article] [PubMed] [Google Scholar]
- 33.Lance C. et al. Multimodal single cell data integration challenge: results and lessons learned. Preprint at 10.1101/2022.04.11.487796 (2022). [DOI] [Google Scholar]
- 34.Svensson V, da Veiga Beltrame E & Pachter L. A curated database reveals trends in single-cell transcriptomics. Database 2020, baaa073 (2020). [DOI] [PMC free article] [PubMed] [Google Scholar]
- 35.Broad Institute. Single Cell Portal. https://singlecell.broadinstitute.org/single_cell (2022).
- 36.Ji Y, Lotfollahi M, Wolf FA & Theis FJ. Machine learning for perturbational single-cell omics. Cell Syst. 12, 522–537 (2021). [DOI] [PubMed] [Google Scholar]
- 37.Fischer DS et al. Sfaira accelerates data and model reuse in single cell genomics. Genome Biol. 22, 248 (2021). [DOI] [PMC free article] [PubMed] [Google Scholar]
- 38.Chan Zuckerberg CELLxGENE Discover. Cellxgene Data Portal. https://cellxgene.cziscience.com/
- 39.Mimitou EP et al. Multiplexed detection of proteins, transcriptomes, clonotypes and CRISPR perturbations in single cells. Nat. Methods 16, 409–412 (2019). [DOI] [PMC free article] [PubMed] [Google Scholar]
- 40.Chen H. et al. Assessment of computational methods for the analysis of single-cell ATAC-seq data. Genome Biol. 20, 241 (2019). [DOI] [PMC free article] [PubMed] [Google Scholar]
- 41.Granja JM et al. ArchR is a scalable software package for integrative single-cell chromatin accessibility analysis. Nat. Genet 53, 403–411 (2021). [DOI] [PMC free article] [PubMed] [Google Scholar]
- 42.Pierce SE, Granja JM & Greenleaf WJ. High-throughput single-cell chromatin accessibility CRISPR screens enable unbiased identification of regulatory networks in cancer. Nat. Commun 12, 2969 (2021). [DOI] [PMC free article] [PubMed] [Google Scholar]
- 43.Buenrostro JD et al. Single-cell chromatin accessibility reveals principles of regulatory variation. Nature 523, 486–490 (2015). [DOI] [PMC free article] [PubMed] [Google Scholar]
- 44.Cusanovich DA et al. Multiplex single-cell profiling of chromatin accessibility by combinatorial cellular indexing. Science 348, 910–914 (2015). [DOI] [PMC free article] [PubMed] [Google Scholar]
- 45.Schep AN, Wu B, Buenrostro JD & Greenleaf WJ. chromVAR: inferring transcription-factor-associated accessibility from single-cell epigenomic data. Nat. Methods 14, 975–978 (2017). [DOI] [PMC free article] [PubMed] [Google Scholar]
- 46.Luecken MD & Theis FJ. Current best practices in single-cell RNA-seq analysis: a tutorial. Mol. Syst. Biol 15, e8746 (2019). [DOI] [PMC free article] [PubMed] [Google Scholar]
- 47.Haque A, Engel J, Teichmann SA & Lönnberg T. A practical guide to single-cell RNA-sequencing for biomedical research and clinical applications. Genome Med. 9, 75 (2017). [DOI] [PMC free article] [PubMed] [Google Scholar]
- 48.Székely GJ & Rizzo ML. Energy statistics: a class of statistics based on distances. J. Stat. Plan. Inference 143, 1249–1272 (2013). [Google Scholar]
- 49.Norman TM et al. Exploring genetic interaction manifolds constructed from rich single-cell phenotypes. Science 365, 786–793 (2019). [DOI] [PMC free article] [PubMed] [Google Scholar]
- 50.Schroder K, Hertzog PJ, Ravasi T & Hume DA. Interferon-γ: an overview of signals, mechanisms and functions. J. Leukoc. Biol 75, 163–189 (2004). [DOI] [PubMed] [Google Scholar]
- 51.Jung S & Marron JS. PCA consistency in high dimension, low sample size context. Ann. Stat 37, 4104–4130 (2009). [Google Scholar]
- 52.Srivatsan SR et al. Massively multiplex chemical transcriptomics at single-cell resolution. Science 367, 45–51 (2020). [DOI] [PMC free article] [PubMed] [Google Scholar]
- 53.Yao D. et al. Scalable genetic screening for regulatory circuits using compressed Perturb-seq. Nat. Biotechnol 10.1038/s41587-023-01964-9 (2023). [DOI] [PMC free article] [PubMed] [Google Scholar]
- 54.Gasperini M. et al. A genome-wide framework for mapping gene regulation via cellular genetic screens. Cell 176, 377–390 (2019). [DOI] [PMC free article] [PubMed] [Google Scholar]
- 55.Barrett T. et al. NCBI GEO: archive for functional genomics data sets – update. Nucleic Acids Res. 41, D991–D995 (2013). [DOI] [PMC free article] [PubMed] [Google Scholar]
- 56.Gatto L. et al. Initial recommendations for performing, benchmarking and reporting single-cell proteomics experiments. Nat. Methods 20, 375–386 (2023). [DOI] [PMC free article] [PubMed] [Google Scholar]
- 57.Tian L, Chen F & Macosko EZ. The expanding vistas of spatial transcriptomics. Nat. Biotechnol 41, 773–782 (2023). [DOI] [PMC free article] [PubMed] [Google Scholar]
- 58.Bredikhin D, Kats I & Stegle O. MUON: multimodal omics analysis framework. Genome Biol. 23, 42 (2022). [DOI] [PMC free article] [PubMed] [Google Scholar]
- 59.Liscovitch-Brauer N. et al. Profiling the genetic determinants of chromatin accessibility with scalable single-cell CRISPR screens. Nat. Biotechnol 39, 1270–1277 (2021). [DOI] [PMC free article] [PubMed] [Google Scholar]
- 60.Vierstra J. et al. Global reference mapping of human transcription factor footprints. Nature 583, 729–736 (2020). [DOI] [PMC free article] [PubMed] [Google Scholar]
- 61.Satpathy AT et al. Massively parallel single-cell chromatin landscapes of human immune cell development and intratumoral T cell exhaustion. Nat. Biotechnol 37, 925–936 (2019). [DOI] [PMC free article] [PubMed] [Google Scholar]
- 62.Wolf FA, Angerer P & Theis FJ. SCANPY: large-scale single-cell gene expression data analysis. Genome Biol. 19, 15 (2018). [DOI] [PMC free article] [PubMed] [Google Scholar]
- 63.Bairoch A. The Cellosaurus, a cell-line knowledge resource. J. Biomol. Tech 29, 25–38 (2018). [DOI] [PMC free article] [PubMed] [Google Scholar]
- 64.Mölder F. et al. Sustainable data analysis with Snakemake. F1000Res. 10, 33 (2021). [DOI] [PMC free article] [PubMed] [Google Scholar]
- 65.Rizzo ML & Székely GJ. Energy distance. WIREs Comput. Stat 8, 27–38 (2016). [Google Scholar]
- 66.Dhapola P. et al. Scarf enables a highly memory-efficient analysis of large-scale single-cell genomics data. Nat. Commun 13, 4616 (2022). [DOI] [PMC free article] [PubMed] [Google Scholar]
- 67.Love MI, Huber W & Anders S. Moderated estimation of fold change and dispersion for RNA-seq data with DESeq2. Genome Biol. 15, 550 (2014). [DOI] [PMC free article] [PubMed] [Google Scholar]
- 68.Aissa AF et al. Single-cell transcriptional changes associated with drug tolerance and response to combination therapies in cancer. Nat. Commun 12, 1628 (2021). [DOI] [PMC free article] [PubMed] [Google Scholar]
- 69.Chang MT et al. Identifying transcriptional programs underlying cancer drug response with TraCe-seq. Nat. Biotechnol 40, 86–93 (2022). [DOI] [PubMed] [Google Scholar]
- 70.Parkinson H. et al. ArrayExpress: a public database of microarray experiments and gene expression profiles. Nucleic Acids Res. 35, D747–D750 (2007). [DOI] [PMC free article] [PubMed] [Google Scholar]
- 71.Datlinger P. et al. Ultra-high-throughput single-cell RNA sequencing and perturbation screening with combinatorial fluidic indexing. Nat. Methods 18, 635–642 (2021). [DOI] [PMC free article] [PubMed] [Google Scholar]
- 72.McFarland JM et al. Multiplexed single-cell transcriptional response profiling to define cancer vulnerabilities and therapeutic mechanism of action. Nat. Commun 11, 4296 (2020). [DOI] [PMC free article] [PubMed] [Google Scholar]
- 73.Mimitou EP et al. Scalable, multimodal profiling of chromatin accessibility, gene expression and protein levels in single cells. Nat. Biotechnol 39, 1246–1258 (2021). [DOI] [PMC free article] [PubMed] [Google Scholar]
- 74.Schraivogel D. et al. Targeted Perturb-seq enables genome-scale genetic screens in single cells. Nat. Methods 17, 629–635 (2020). [DOI] [PMC free article] [PubMed] [Google Scholar]
- 75.Shifrut E. et al. Genome-wide CRISPR screens in primary human T cells reveal key regulators of immune function. Cell 175, 1958–1971 (2018). [DOI] [PMC free article] [PubMed] [Google Scholar]
- 76.Tian R. et al. CRISPR interference-based platform for multimodal genetic screens in human iPSC-derived neurons. Neuron 104, 239–255 (2019). [DOI] [PMC free article] [PubMed] [Google Scholar]
- 77.Weinreb C, Rodriguez-Fraticelli A, Camargo FD & Klein AM. Lineage tracing on transcriptional landscapes links state to fate during differentiation. Science 367, eaaw3381 (2020). [DOI] [PMC free article] [PubMed] [Google Scholar]
- 78.Xie S, Duan J, Li B, Zhou P & Hon GC. Multiplexed engineering and analysis of combinatorial enhancer activity in single cells. Mol. Cell 66, 285–299 (2017). [DOI] [PubMed] [Google Scholar]
- 79.Zhao W. et al. Deconvolution of cell type-specific drug responses in human tumor tissue with single-cell RNA-seq. Genome Med. 13, 82 (2021). [DOI] [PMC free article] [PubMed] [Google Scholar]
Associated Data
This section collects any data citations, data availability statements, or supplementary materials included in this article.
Supplementary Materials
Data Availability Statement
The website scperturb.org stores harmonized datasets with the following: scRNA-seq and antibody-based protein datasets: .h5ad files; scATAC-seq: multiple different feature matrix definitions as separate download options. RNA data at https://doi.org/10.5281/zenodo.7041848 and ATAC data at https://doi.org/10.5281/zenodo.7058381. Dataset access details: AdamsonWeissman20167: GSE90546 on GEO55; AissaBenevolenskaya202168: GSE149383 on GEO; ChangYe202169: E-MTAB-10698 on ArrayExpress70; DatlingerBock20171: GSE92872 on GEO; DatlingerBock202171: GSE168620 on GEO; DixitRegev20162: GSE90063 on GEO; FrangiehIzar20216: SCP1064 on the Broad Single Cell Portal https://singlecell.broadinstitute.org/single_cell/study/SCP1064/multi-modal-pooled-perturb-cite-seq-screens-in-patient-models-define-novel-mechanisms-of-cancer-immune-evasion; GasperiniShendure201954: GSE120861 on GEO; GehringPachter201919: https://doi.org/10.22002/D1.1311 on CaltechDATA; Liscovitch-BrauerSanjana202159: GSE161002 on GEO; McFarlandTsherniak202072: https://doi.org/10.6084/m9.figshare.5863776.v1 on figshare; MimitouSmibert202173: GSE156476 on GEO; NormanWeissman201949: GSE133344 on GEO; PapalexiSatija2029: GSE153056 on GEO; PierceGreenleaf202142: data deposited on AWS, URIs to be found at https://www.ncbi.nlm.nih.gov/pmc/articles/PMC8137922/bin/41467_2021_23213_MOESM9_ESM.xlsx; ReplogleWeissman202220: processed single-cell data from gwps.wi.mit.edu; Schiebinger-Lander201923: GSE106340 and GSE115943 on GEO; SchraivogelSteinmetz202074: GSE135497 on GEO; ShifrutMarson201875: GSE119450 on GEO; SrivatsanTrapnell202052: GSE139944 on GEO; TianKampmann201976: GSE152988 on GEO with mappings from kampmannlab.ucsf.edu/crop-seq; TianKampmann202121: GSE124703 on GEO; WeinrebKlein202077: GSE140802 on GEO; XieHon201778: GSE81884 on GEO; ZhaoSims202179: GSE148842 on GEO.
Open access source code is at https://github.com/sanderlab/scPerturb/. We compiled a corresponding Python package called scperturb for performing E-statistics (E-distance and E-testing) in single-cell data, published on PyPI under https://pypi.org/project/scperturb/. Access details for the original publication for each dataset are available in the scPerturb GitHub repository (https://github.com/sanderlab/scPerturb) in the subfolder 'dataset_processing'.