Figure 1.
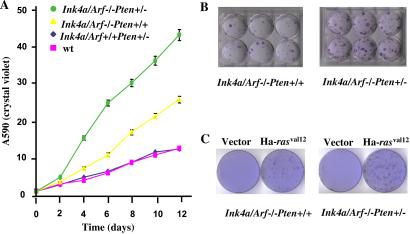
Growth potential of Ink4a/Arf−/−Pten+/+ and Ink/Arf4a−/−Pten+/− MEFs. (A) Growth curve of MEFs. MEFs were plated at 25,000 cells per well in triplicate wells of 12-well plates and cultured for the indicated number of days. Cells were fixed and stained with crystal violet. Adsorption at OD 540 was measured for each time point for individual MEF lines and directly correlates with cell numbers (15). Each symbol represents the mean of triplicate readings of six lines. The standard errors are indicated. (B) Colony formation in MEFs. MEFS were plated at 3,500 cells per 6-well plate, cultured for 12 days, and fixed and stained with crystal violet. Representative plates are shown. (C) Transformation of MEFs. Neoplastic transformation foci of MEFs with Ha-rasVal12. Control plates were transfected with an empty vector.

