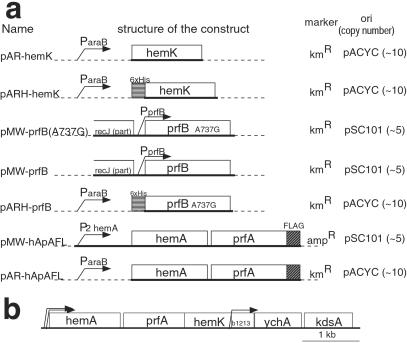
Figure 1.
(a) Structures of the key constructs used in this study. Name, schematic structure of the construct, selection marker, and type of replicon (copy number per cell) is shown for each plasmid. Sequences derived from chromosomes are shown by thick lines and those from vectors by dashed lines. (b) The gene map around hemK in E. coli. The coding region of each gene (open boxes) and the locations of promoters (ref. 36, bent arrows) are shown. All genes are transcribed from left to right.

