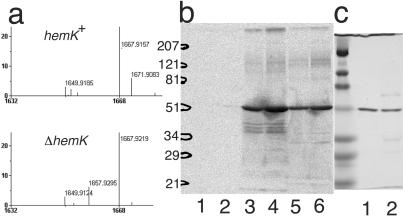
Figure 4.
Methylation of RFs by HemK. (a) Matrix-assisted laser desorption ionization–time of flight MS analysis of a tryptic digest of RF1 from CA293(hemK+) or CK783(ΔhemK). A section of the MS spectrum of the tryptic digest of RF1-FLAG is shown. The predicted m/z value for each fragment after correction for the isotopes is indicated. A peak matching the predicted mass of the 229–245 peptide (1657.8 m/z) was present in the sample from ΔhemK cells, but this peak was apparently shifted by 14 points (to 1671.9 m/z) in the sample from hemK+ cells. (b) SDS/PAGE analysis of in vitro-methylated RFs. The methylation reaction was performed on a 10-fold larger scale than described in Table 3 and the samples were subjected to SDS/PAGE (12% polyacrylamide). 3H-labeled protein was then visualized by autoradiography. In each reaction, 1 μg of 6×His-HemK was used as enzyme, and the substrate was: lane 1, 5 μg of BSA; lane 2, 10 μg of BSA; lane 3, 5 μg of RF1-FLAG; lane 4, 10 μg of RF1-FLAG; lane 5, 5 μg of 6×His-RF2; and lane 6, 10 μg of 6×His-RF2. The positions of the size markers are shown on the left. (c) One microgram of RF1-FLAG (lane 1) or 6×His-RF2 (lane 2) was analyzed by SDS/PAGE with the same size markers as in b and stained by using Coomassie brilliant blue.

