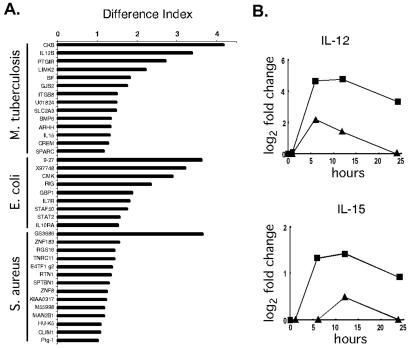
Figure 2.
Differences in expression profiles distinguish between bacteria. (A) Differential gene expression in macrophages exposed to M. tuberculosis, E. coli, or S. aureus. The difference index represents how expression levels induced by the three bacteria differ from the average expression level induced by all bacteria studied: large values are assigned to genes whose expression levels exhibit the greatest differences in specific bacterial infections. Multiple time course experiments were used (M. tuberculosis, two repeats; E. coli, three repeats; and S. aureus, two repeats). For every gene within each profile, the responses of macrophages to each of the bacterial species in question were compared with the average response to all bacterial species studied. Statistically significant differences were identified by using Student's t test (P < 0.005). The difference index was calculated as follows: D.I. = log2 (fold-change of gene X in infection A) − log2 (avg fold-change of gene X in all infections) . (B) M. tuberculosis induced lower levels of macrophage IL-12 and IL-15 gene expression than the average expression measured across all data sets. The average fold-change values observed after exposure to M. tuberculosis (▴) are displayed for the time course. In comparison, the average fold-change values across all data sets was significantly greater (■).

