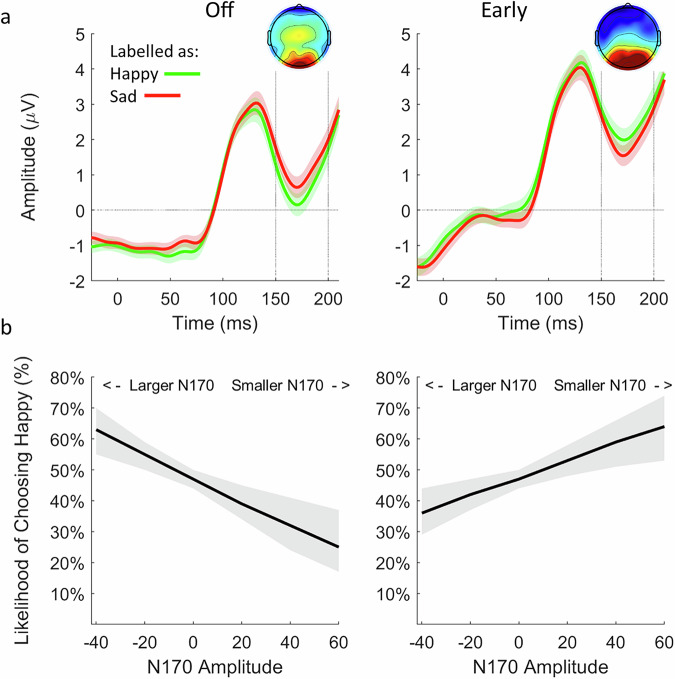
Fig. 5. Relationship between N170 amplitude and choice.
a N170 for all faces categorised as happy (green) and sad (red) in the off (left) and early (right) fNMES conditions. Waveforms and topographic maps show the average of channels identified in the mass-univariate analysis, between 150 and 200 ms after face onset. Shaded areas show standard error. b Derived marginal means from a model predicting choice of each trial by fNMES and N170 amplitude in the off (left) and early (right) fNMES conditions. In the off condition, a larger N170 amplitude increased the likelihood of labelling a face as happy. In contrast, in the early fNMES condition, a smaller N170 increased this likelihood. Shaded areas show 95% confidence intervals. N = 51.

