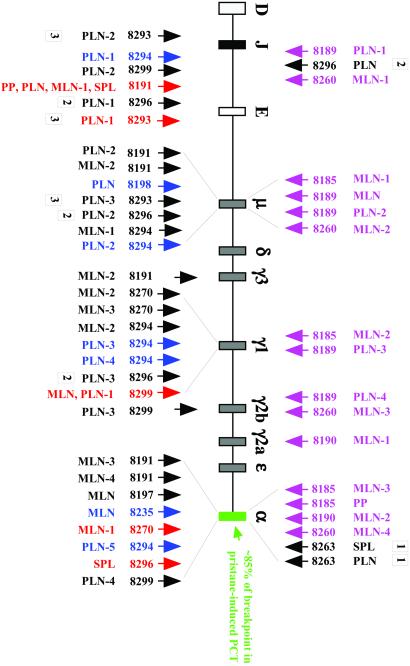
Figure 5.
Map of T(12;15) breakpoints in IgH. Break sites with Myc are indicated by arrows. Each arrow represents a distinct T(12;15)+ cell clone. Mouse numbers and tissue designations are the same as in Table 1. Upwards pointing arrows designate Myc rearrangements in hyperplastic donor tissues: blue, rearrangements occurred in tissues that were not transplantable; black, rearrangements were not redetected in recipient tumors, yet they occurred in tissues that gave rise to tumors with different Myc junctions; red, rearrangements were detected in corresponding donor and recipient tissues. Three Myc rearrangements found in recipient tumors (down-pointing black arrows labeled 1 or 2) are included to illustrate two points made in the last paragraph of Results. The Myc rearrangements of 19 additional recipient tumors (Cμ, 2 cases; Cγ1, 3 cases; Cα, 3 cases; JH/Eμ, 11 cases) were analyzed by PCR, but were not included in the figure for clarity of presentation. Samples with hyphenated numbers contained multiple T(12;15)+ clones in the same tissue (e.g., three clones in the PLN sample of mouse 8293; arrows labeled 3).

