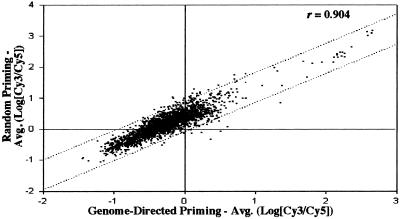
Figure 2.
Correlation of Cy3/Cy5 fluorescence intensities of Cy3-labeled cDNA derived by either random priming or using B31-specific GDPs. The dotted lines represent data within 2 SDs of regression (95% confidence). r, correlation coefficient for the similarity between mean log ratios for each feature from the different labeling protocols.

