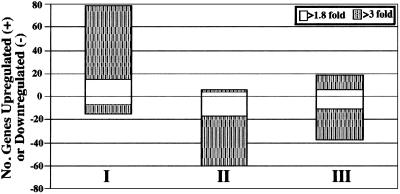
Figure 3.
Number of genes differentially expressed during various B31 culture conditions. The UT growth condition was used as a baseline reference. The bars reflect comparisons between the UT and FT (I), FT and DMC (II), and UT and DMC (III) growth conditions. The white areas denote gene expression changes of 1.8–3.0-fold, whereas shaded areas signify changes >3-fold. Individual gene listings are provided in Tables 3–5.

