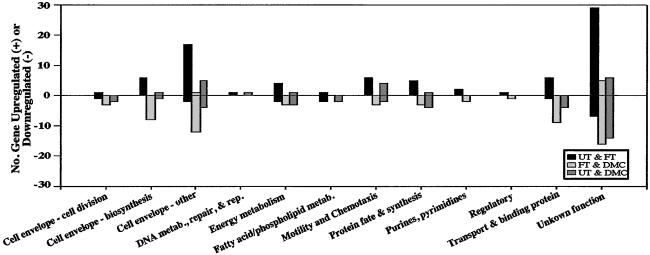
Figure 6.
Number of differentially expressed genes grouped by putative protein functions. The UT growth condition was used as a baseline reference. The bars reflect comparisons between the UT and FT (black), FT and DMC (light gray), and UT and DMC (dark gray) growth conditions. Individual gene listings are provided in Tables 3–5.

