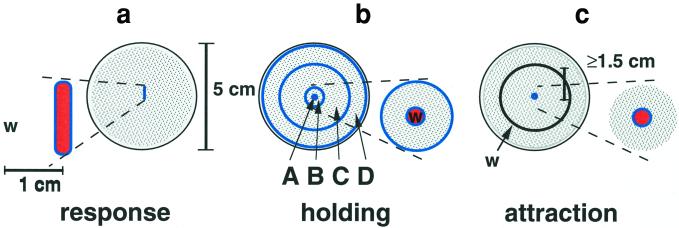
Figure 1.
Design of response, holding, and attraction assays. Trials were performed on 5-cm agar plates with 2-day-old bacterial lawns (gray, stippled area). Individual test animals (w) were introduced ≈1 cm from scoring region in the response assay (a), directly on area A in the holding assay, dispersing on their release (b), and more than 1.5 cm from conditioned point source in the attraction assay (c). Unconditioned or conditioned regions are denoted in orange, and blue lines demark scoring region and areas (A–B–C–D).

