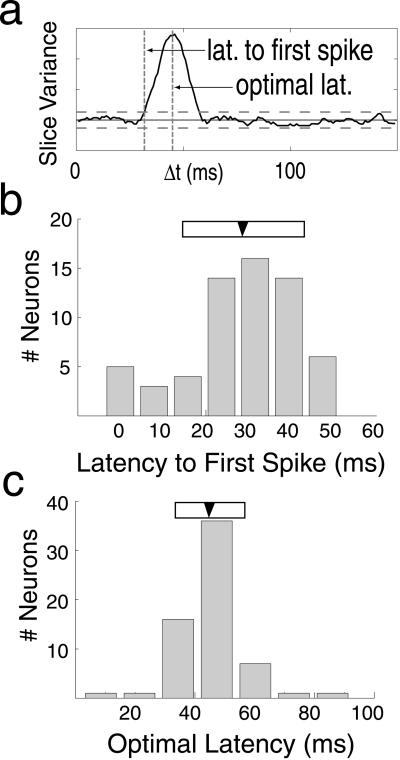
Figure 2.
Latency measurements from STRFs. The time course of tuning can be visualized by plotting the overall variance of each SF-orientation slice as a function of Δt. (a) Solid line indicates the variance profile for a single V1 neuron. Horizontal solid and dashed lines indicate the mean ± 2SD (computed from Δt < 0; see text for details). (b) Latency to first spike is defined as the first time point when the variance exceeds twice the SD of the noncausal region of the STRF. Very short latencies apparent in the histogram (<20 ms) are caused by noise. Artifactually short estimates of the latency to first spike are caused by spurious peaks in the variance profile that can push the profile over the 2SD threshold. (c) Optimal latency, the latency at which the cell is maximally selective, is given by the peak of the variance curve (see text for details). For both histograms, the filled arrowheads and open horizontal bars indicate the mean ± SD.

