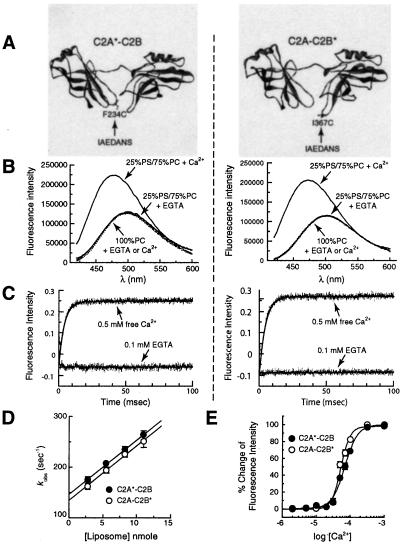
Figure 1.
AEDANS reporters indicate that both C2 domains of syt I interact rapidly with membranes. (A) Molecular models depicting the labeling sites in the cytoplasmic domain of syt I (designated C2A-C2B). The fluorophore, IAEDANS, was used to label the thiol side chains of the lone Cys residues engineered into Ca2+-binding loop 3 of C2A or C2B. The label is indicated by *; C2A*-C2B harbors an AEDANS reporter labeled in the C2A domain (F234C); C2A-C2B* harbors an AEDANS reporter labeled in the C2B domain (I367C). These labels are shown by using the crystal structure of syt III (20) as a template; images were rendered by using WebLab VIEWERLITE 3.7 software. (B) Ca2+/liposome-dependent changes in the fluorescence of C2A*-C2B and C2A-C2B*. C2A*-C2B and C2A-C2B* were adjusted to 0.5 μM in Hepes and excited at 336 nm; the emission spectra were then collected from 420 to 600 nm. Spectra were first obtained in the presence of 0.1 mM EGTA and liposomes. Liposome composition (25% PS/75% PC) and concentration (11 nM liposomes, 1 mM total lipid) are the same for all experiments unless otherwise indicated. Ca2+ was then added to a final free concentration of 0.5 mM. In the presence of Ca2+ and liposomes, both C2A*-C2B and C2A-C2B* showed large increases in fluorescence intensity (71.8% and 77.8% for C2A*-C2B and C2A-C2B*, compared with the intensity in EGTA at 474 nm) and exhibited significant blue shifts (for C2A*-C2B, from 500 nm to 476 nm; for C2A-C2B*, from 502 nm to 474 nm) in their emission maxima (solid lines). Identical amounts of liposomes lacking anionic phospholipids (100% PC) did not induce fluorescence changes in the presence or absence of Ca2+ (dashed lines). (C) Stopped-flow mixing experiments demonstrate that the reporters in C2A*-C2B and C2A-C2B* rapidly penetrate membranes with similar kinetics. The fluorescence changes exhibited by C2A*-C2B or C2A-C2B* were used to monitor the kinetics of Ca2+-triggered interactions with liposomes, using an Applied Photophysics SX.18MV stopped-flow spectrometer. (Left) C2A*-C2B (1 μM) was premixed with liposomes (22 nM) and EGTA (0.1 mM), and then rapidly mixed with Ca2+ (0.5 mM final free [Ca2+]). The kinetics of this reaction are shown in the upper trace. As a control, mixing experiments were also carried out by using 0.1 mM EGTA instead of Ca2+ (lower trace), providing a minimum reference point. Data (4,000 points) were collected for 100 ms and are plotted with a best-fit single exponential function (kobs = 257 s−1). (Right) The same experiment was carried out, except using C2A-C2B* (kobs = 247 s−1). (D) Determination of kon and koff for the C2A*-C2B or C2A-C2B*⋅liposome complexes in the presence of Ca2+. Stopped-flow rapid mixing experiments were carried out as in C; kobs was determined by fitting the data with single exponential functions and plotted vs. [liposome]. The Y-intercept yields koff for the C2A*-C2B⋅liposome complex in the presence of Ca2+ (146.6 ± 6.9 s−1), and the slope yields kon (1.06 ± 0.09 × 10¹⁰ M−1⋅s−1) (10). Almost identical data were obtained for the cryptic lipid penetration activity of C2B, as revealed by analysis of C2A-C2B*; koff was 134.6 ± 9.3 s−1 and kon was 1.07 ± 0.12 × 10¹⁰ M−1⋅s−1. Error bars represent standard deviations from three independent experiments. In Ca2+, the dissociation constant for the C2A-C2B⋅liposome complex was ≈13–14 nM. (E) Steady-state Ca2+ dependency of C2A*-C2B and C2A-C2B* penetration into liposomes. The corrected emission spectra were obtained as described in B and integrated. The changes in fluorescence intensity were normalized, plotted, and fit as a function of [Ca2+]free with GRAPHPAD PRISM 2.0 software. For C2A*-C2B (●), the [Ca2+]1/2 was 69 ± 1.3 μM (Hill coefficient = 2.3); for C2A-C2B* (○), the [Ca2+]1/2 was 53 ± 1.4 μM (Hill coefficient = 3.2).

