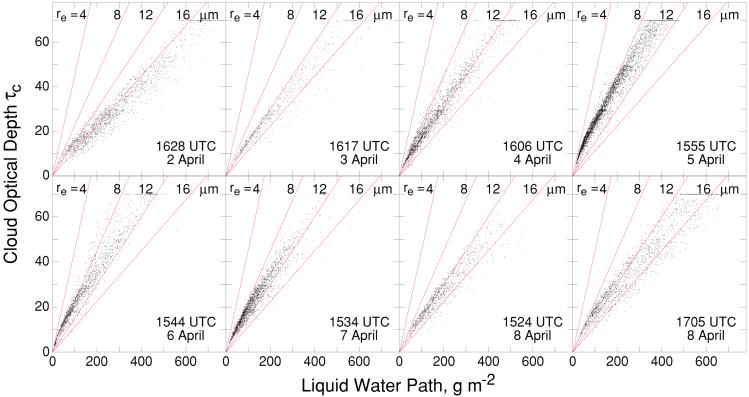
Figure 3.
Pixel-average cloud optical depth τc as a function of vertical cloud LWP for eight satellite overpasses over the study area 50–55°N, 25–30°W, for April 2–8, 1987. Data points with τc > 70 are plotted at τc = 70 because of insensitivity of retrieval method at high optical depth; these points are evident as horizontal clusters at τc = 70. Data points with τc ≲ 3 have been excluded to eliminate pixels that could be covered by haze but not clouds. Lines denote cloud optical depth for indicated constant values of effective radius near cloud top, re.

