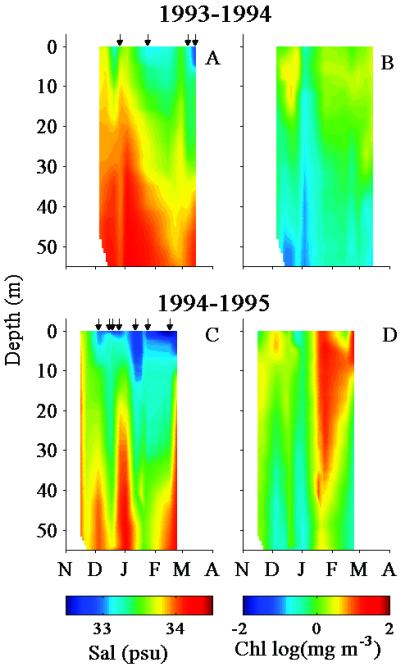
Figure 2.
Time series (November–March) of the vertical profiles of salinity and Chl at station B from two example seasons: a relatively low biomass season (1993–1994) (A and B); and a high-biomass season (1994–1995) (C and D). The left column is salinity and the right column is Chl. Small arrows on the top of the salinity panels denote the stations that were considered turbid because of high radiance reflectance.

