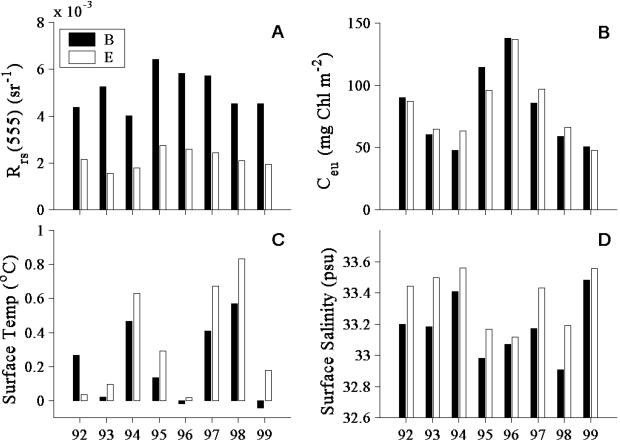
Figure 3.
Bar graphs comparing the seasonal mean values (November–March) of four parameters determined in surface waters at stations B (inlet to Arthur Harbor) and E (3.7 km offshore) from 1991–1992 through 1998–1999. (A) Radiance reflectance. (B) Water-column integrated Chl. (C) Temperature. (D) Salinity.

