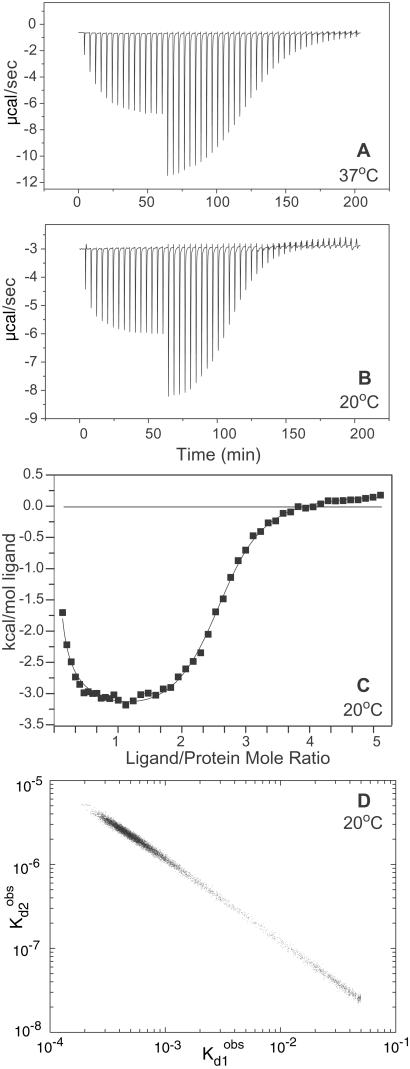
Figure 3.
Isothermal titration calorimetry results for glycocholic acid binding to human I-BABP. The raw data collected at 37°C (A) and 20°C (B) are shown as injection profiles. The discontinuity at an x axis value of ≈60 min represents a change in the injection volume from 4 μl to 7 μl. C displays the calorimetric binding isotherm for the data collected at 20°C. The y axis is the normalized heat released or absorbed for each injection of ligand. The curve through the points represents a least squares fit to the two-step binding model. The fitting equations are defined in Supporting Text, which is published as supporting information on the PNAS web site. D displays the Bayesian analysis of the probability distribution of the fitted stepwise dissociation constants for the data at 20°C.

