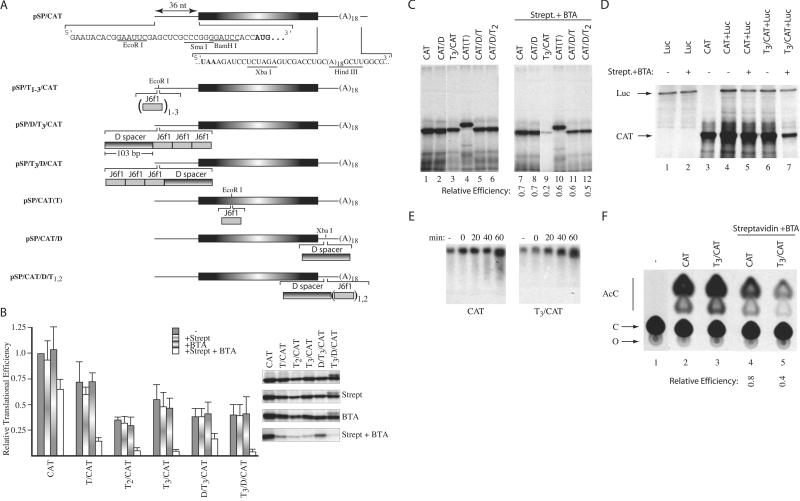
Figure 3.
Inhibition of eukaryotic translation by forced protein/RNA interaction. (A) The nucleotide sequence within the 5′ and 3′ UTRs of the CAT reporter used in this study is presented, and the CAT initiation and termination codons are shown in bold. The J6f1 aptamer is denoted by a gray shaded box, and the sequence used as a spacer (labeled D spacer) is denoted as a box with horizontal shading. Subscripts denote the number of copies inserted within a reporter. (B) Relative translation efficiencies of reporters containing tobramycin-binding sites within their 5′ UTRs. Translations were performed with RNA alone (20 μg/ml) or in the presence of 16.6 μg/ml of streptavidin, 10 μM BTA, or 16.6 μg/ml of streptavidin + 10 μM BTA, and the efficiencies standardized to the efficiency obtained with CAT mRNA, which was set at one. In these experiments, streptavidin and BTA were first mixed with the translation extracts, and mRNA templates were added last. All values represent the average of at least four independent experiments, with trichloroacetic acid precipitation counts performed in duplicate for each experiment. Standard deviations are shown. To the right of the bar graph is a representative autoradiograph from one experiment, illustrating the translation products obtained with each reporter. (C) Relative translational efficiencies of reporters containing tobramycin-binding sites within the CAT coding or 3′ UTR. The identity of the input RNA and the presence of 16.6 μg/ml of streptavidin + 10 μM BTA are indicated (Top). Shown below are the relative translational efficiencies compared with the input mRNA translated in the absence of streptavidin + BTA (average of two experiments). The largest SE for this data set was ± 0.1. (D) Cotranslation of luciferase and CAT reporters in the presence or absence of 16.6 μg/ml of streptavidin/10 μM BTA (indicated above lanes). The positions of migration of luciferase and CAT products are indicated. After electrophoresis in a 10% SDS/polyacrylamide gel, the gel was treated with EN3Hance, dried, and exposed to X-Omat (Kodak) film. (E) Stability of CAT and T3/CAT mRNA in translation extracts. 3H-labeled CAT and T3/CAT mRNA were translated in the presence of 16.6 μg/ml of streptavidin/10 μM BTA. At the indicated times, an aliquot of the translation was removed (10 μl) and incubated with 50 μg of Proteinase K at 37°C for 15 min, after which the sample was phenol/chloroform extracted. After ethanol precipitation, RNA samples were fractionated on a 1.2% agarose/formaldehyde gel. The gel was treated with En3Hance, dried, and exposed to X-Omat x-ray film (Kodak) at −70°C with an intensifying screen. (F) Effect of BTA on translation of CAT and T3/CAT in vivo. Translations in Xenopus oocytes consisted of microinjecting 10 oocytes with 50 nl of [3H]CTP-labeled mRNA (5 ng) alone or in combination with streptavidin (17 ng) and BTA. Given an average oocyte diameter of 1.2 mm (≈0.7 μl) (31), this achieved a final concentration of ≈7 μg/ml of mRNA, 24 μg/ml of streptavidin, and 10 μM BTA. Oocytes were incubated at 20°C for 2 h, homogenized in lysis buffer (20 mM Tris⋅HCl, pH 7.6/0.1 M NaCl/1% Triton X-100/1 mM phenylmethylsulfonyl fluoride), centrifuged in a microfuge for 5 min at 14,000 ×g, and the supernatant used to measure CAT activity (32). An autoradiograph of a representative TLC for the CAT assays performed is shown. The relative expression was calculated by comparing the relative conversion for each sample in the presence of streptavidin/BTA to the conversion obtained with the same mRNA in the absence of streptavidin/BTA, which was set as one. The nature of the injected mRNA and the presence of streptavidin and BTA are indicated (Top). Shown below is the relative translational efficiencies compared with the mRNA injected in the absence of streptavidin + BTA (average of two experiments). AcC, acetylated forms of chloramphenicol; C, chloramphenicol; O, origin.

