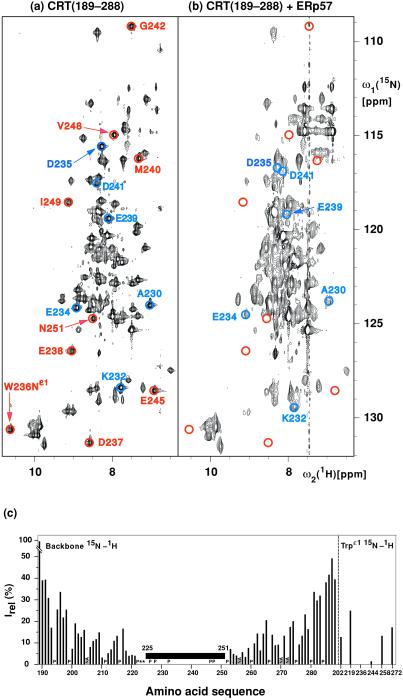
Figure 2.
(a and b) 15N–1H correlation NMR spectra used to delineate the surface areas of CRT(189–288) that interact with ERp57. These spectra contain peaks corresponding to backbone amide 15N–1H groups and, in the lower left, indole 15N–1H groups of tryptophyl residues. Color-coded peaks indicate outstandingly large effects from ERp57 interactions: Blue circles identify cross peaks with chemical shift differences of more than 0.2 ppm along the 15N dimension between free and ERp57-bound CRT(189–288). Red circles identify cross-peak positions in free CRT(189–288) for which no counterpart could be observed in the spectrum of the complex. The color-coded cross peaks are labeled with the sequence-specific resonance assignments. (a) [15N,1H]TROSY spectrum of free 15N,2H-labeled CRT(189–288) (protein concentration = 0.4 mM, polarization transfer time = 5.4 ms, data size 200 × 1,024 complex points, zero-filling to 512 × 2,048 points, t1,max = 88 ms, t2,max = 98 ms, total measuring time 2 h). (b) [15N,1H]TROSY spectrum of a solution of 15N,2H-labeled CRT(189–288) and unlabeled ERp57 [protein concentrations of 0.14 mM for 15N,2H-labeled CRT(189–288) and 0.38 mM for ERp57, polarization transfer time = 3.4 ms, data size 100 × 1,024 complex points, zero-filling to 512 × 2,048 points, t1,max = 44 ms, t2,max = 98 ms, total measuring time 24 h]. (c) Plot of the relative peak intensities, Irel, of the [15N,1H]TROSY cross peaks in the CRT(189–288)/ERp57 complex and free CRT(189–288) versus the amino acid sequence of CRT(189–288). The Trp indole cross peaks are listed separately on the right. The black horizontal bar spanning the polypeptide segment 225–251 indicates that for these residues the cross peaks in the complex have either large chemical shift differences (> 0.2 ppm along the 15N dimension) or very small signal intensities [< 3% of the intensity in free CRT(189–288)] (see text). P designates proline residues, NA stands for residues for which no resonances could be assigned, and * indicates residues for which no reliable data could be measured because of spectral overlap.

