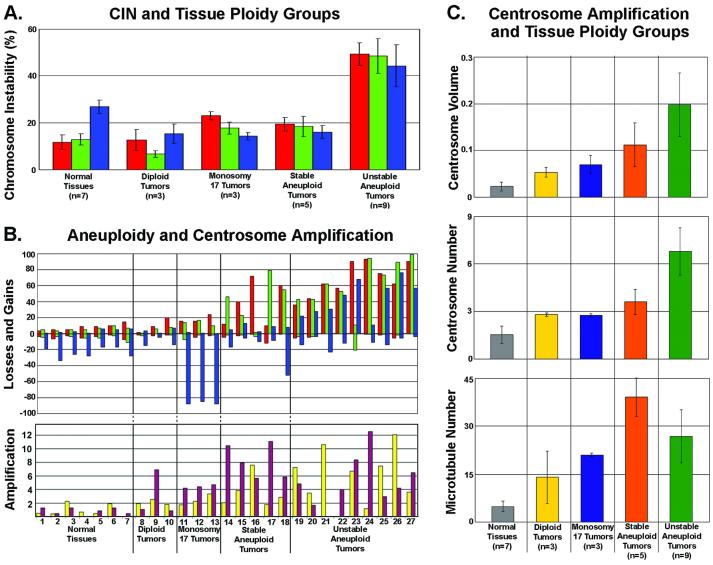
Figure 2.
Analysis of chromosomal instability, aneuploidy, and centrosome amplification for the five tissue ploidy groups. (A) Plot of CIN (% cells showing chromosome number differing from the modal value for that particular chromosome) for the various tissue ploidy groups. (B) Plots of aneuploidy and centrosome amplification. (Upper) Plot of chromosome losses and gains for each sample in each tissue ploidy group. For both A and B: red bars, chromosome 3; green bars, chromosome 7; blue bars, chromosome 17. (Lower) Plot of centrosome amplification for each sample in each tissue ploidy group. Yellow bars, normalized centrosome size and number index; maroon bars, normalized microtubule nucleation index. (C) Plots of three different measures of centrosome amplification (centrosome volume in μm3, centrosome number, and microtubule nucleation) for each tissue ploidy group. Bars in A and C indicate standard deviation.

