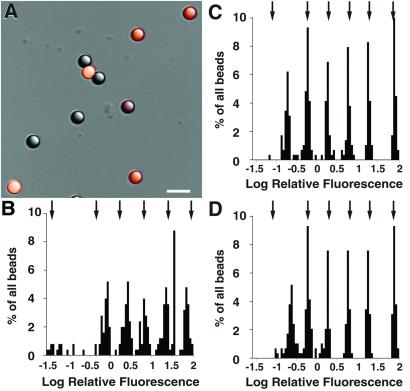
Figure 2.
WFM and LSCM imaging of calibrated fluorescent standards. (A) Combined differential interference contrast and fluorescence image of a mixture of 2.5 μm polystyrene beads with six different fluorophore densities, appearing here as orange (brightly fluorescent) to gray (weakly fluorescent). (Scale bar, 5 μm.) (B–D) Total fluorescence in 3D images of beads (see Methods). The plots show the distribution of fluorescence measured by LSCM (B), WFM (C), and WFM after image deconvolution (D). After deconvolution, the absolute fluorescence rises substantially as out-of-focus information is shifted to an in-focus position, but the relative intensities do not change. The arrows indicate the median fluorescence of each bead population measured by FACS (see Supporting Methods).

