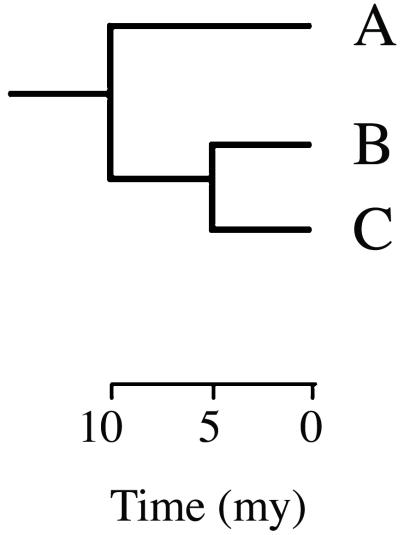
Figure 1.
A hypothetical phylogeny of three taxa. Measures of phylogenetic diversity are represented by branch lengths, with time (my, millions of years) measured across the horizontal axis. “Species evolutionary history” is calculated by the length of the branch to the most recent ancestral split. For example, for species C, this is equal to 5 my, whereas for species A the value is 10 my. “Clade evolutionary history” includes all branches in a set of taxa. For the clade containing species B and C this is equal to 15 my, because it includes all of the higher shared branches.

