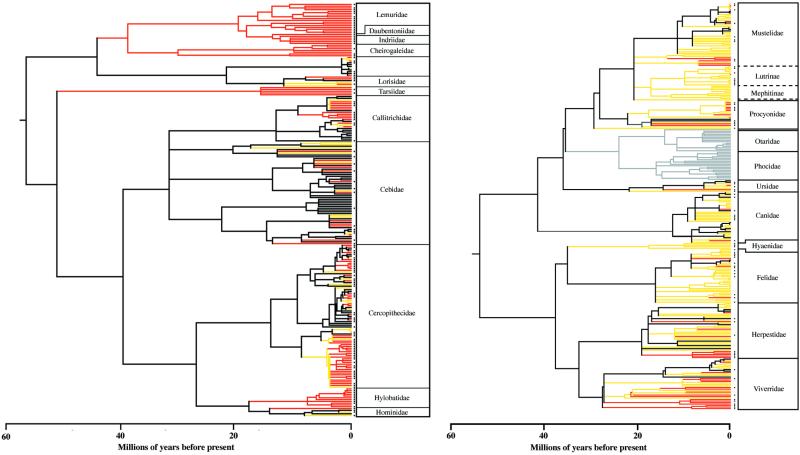
Figure 2.
Phylogenetic patterns of primates (Left) and carnivores (Right) residing in biodiversity hotspots. Species hotspot designation is used to color branches where extant PD exists. Red branches represent PD found only in hotspots (endemic), yellow branches represent PD occurring in hotspots, and black branches represent PD not occurring in hotspots. Threatened species are indicated with an asterisk. Across carnivores, the pinnipeds are represented in gray to denote that they were excluded from analyses because of their aquatic geographic range distributions.

