
FIGURE 1.
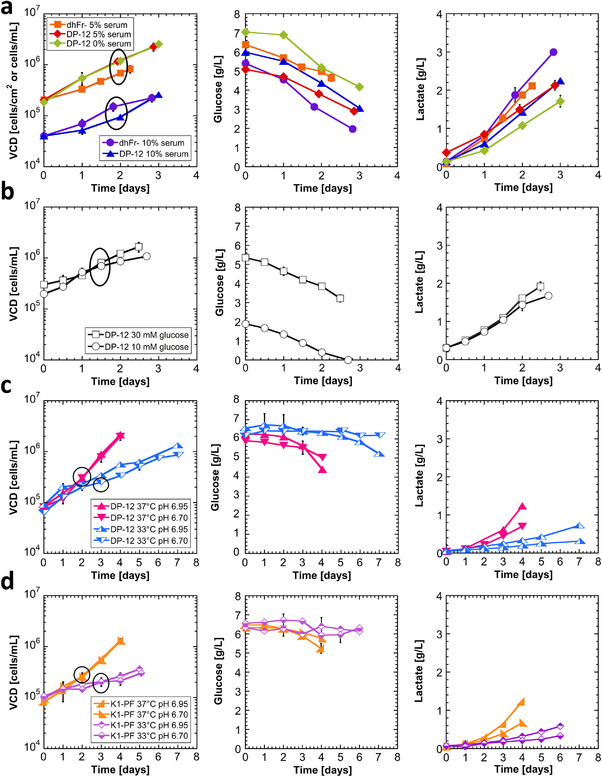
Culture growth and metabolite profiles for (a) serum‐free adaptation dataset, (b) glucose dataset, (c) DP‐12 temperature/pH dataset, (d) K1‐PF temperature/pH dataset. Circled data represent RNA extraction timepoints. Error bars represent the standard deviation of biological replicates (N = 2). To facilitate visual comparisons, the same symbols and colors are used in both Figures 1 and 2.