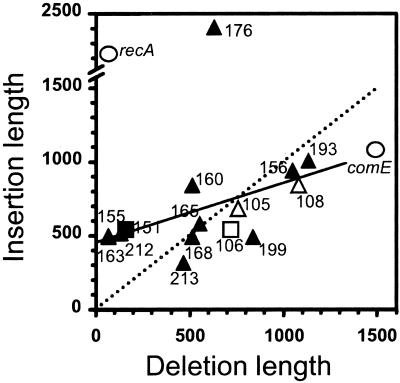
Figure 4.
Correlation diagram of the length of inserted and deleted segments. Filled and open symbols indicate InsDels isolated in the TCHA3 and TCHA2 recipients, respectively. recA and comE InsDels are shown as open circles. Identical InsDel independently obtained in TCHA3 (IΔ151) and TCHA2 (IΔ106) recipients are indicated by a square. Note that the linear regression of points (excluding recA and comE InsDel) weighted differently to take into account multiple occurrences of the same NJ (solid line) differs from the dotted line. A fit to the latter (which corresponds to a slope of 1) would indicate a one-to-one correlation between the length of insertions and deletions.

