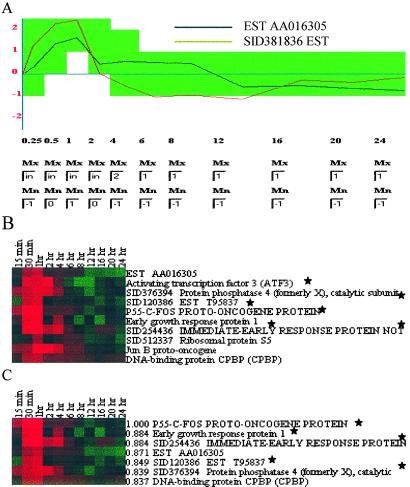
Figure 3.
gabriel analyses. (A) Graphical interface showing parameters selected by user for the I/E event response rule. Sampling times during the experiment are designated by using entry boxes and are represented on the x axis. The y axis represents the gene expression level after the base-2 logarithm transformation. Entry boxes allow users to define maximum and minimum thresholds for zones (green region) of expression at each time point; in indicates infinity. Zones defined in this interface are translated by gabriel into a textual representation of the rule. Activation of the search identifies gene expression profiles that satisfy the specified parameters. In this example, the user wants to find genes whose expression is defined to increase gradually from 0.25 h to 1 h after serum addition, reach a peak at 2 h, decrease to the baseline by 6 h, and remain there throughout the duration of the experiment. The black line within the green zone is the profile of an expressed sequence tag (AA016305) selected by this rule but not included in the I/E response gene cluster (cluster E) of Iyer et al. (18). The red line (expressed sequence tag SID381836), which was included in cluster E, falls outside the defined parameters (green zone) at the one- and two-time points and was not selected by this gabriel rule. (B) Genes identified by the rule defined by parameters shown in A. The display style follows that of Eisen et al. (41): log ratios of 0 (unchanged) are shown as black, positive ratios (up-regulation) are represented by red, and negative ratios (down-regulation) are represented by green. The intensity is increased to correspond to the experimentally determined ratios. Genes common to the I/E response cluster E in figure 2 of Iyer et al. (18) are designated by *. The FDR was calculated by random permutation rule by randomly shuffling the expression level at different time points more than 100 times and used to estimate the statistical probability (0.3 in this case) of spurious assignment of a profile to a defined pattern. (C) Genes identified by a c-fos proband-based rule. The c-fos gene was designated as proband, and 0.8 correlation coefficient over 11 time points was the specified threshold. Genes were sorted according to their correlation coefficient (the first numbers on each row) with c-fos. Including c-fos, five of the genes selected by gabriel (designated by *) were in cluster E, a seven-gene c-fos-containing hierarchical cluster chosen by Iyer et al.

