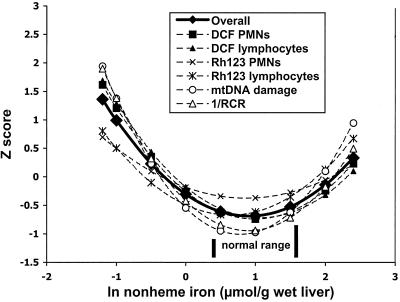
Figure 3.
Analysis of nonlinear regression models: comparison of an overall model and individual models of Z-transformed values of the six dependent variables vs. liver ln-nonheme iron. Each of the six dependent variables (five were analyzed by nonlinear regression, as shown in Figs. 1 and 2) was transformed to a Z score and modeled as a quadratic function, using ln-liver nonheme iron as the independent variable. The equation for the RCR ratio's Z score was obtained from inverted RCR values (1/RCR, a measure of inefficiency), resulting in normal rats having lower rather than higher values. Each model line was obtained from nine values of liver iron. All statistics were performed as described in Materials and Methods.

