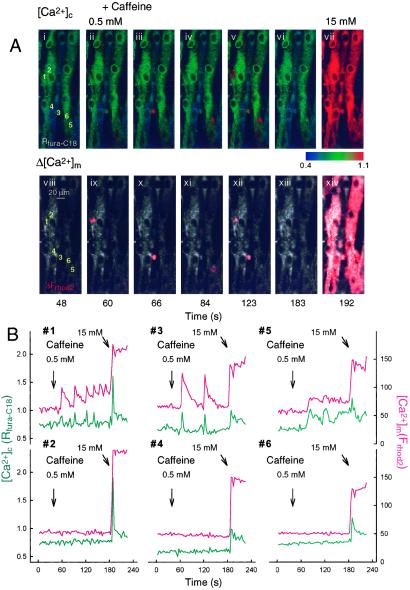
Figure 1.
Spatially restricted [Ca2+]c and [Ca2+]m spikes evoked by submaximal activation of the RyR. Fluorescence imaging of [Ca2+]c and [Ca2+]m responses evoked by caffeine in rhod2-loaded permeabilized myotubes was performed. (A) The pseudocolor ratio images (340 nm/380 nm; blue, low [Ca2+]; red, high [Ca2+]) in Upper show the changes in fura-C18 fluorescence ([Ca2+]c) after the addition of 0.5 mM (ii–vi) and 15 mM (vii) caffeine. The gray images in Lower show the rhod2 fluorescence ([Ca2+]m), and the red overlays show the fluorescence changes from increased [Ca2+]m at each time point, measured simultaneously with [Ca2+]c. (B) Time courses of [Ca2+]c and [Ca2+]m changes for the numbered regions. Regions were selected in the areas displaying local [Ca2+]c spiking in response to 0.5 mM caffeine (1, 3, 5) and in adjacent regions that exhibited a response only during stimulation with maximal caffeine (2, 4, 6). A [Ca2+]m rise was coupled to every localized [Ca2+]c spike in the selected regions (see graphs).

