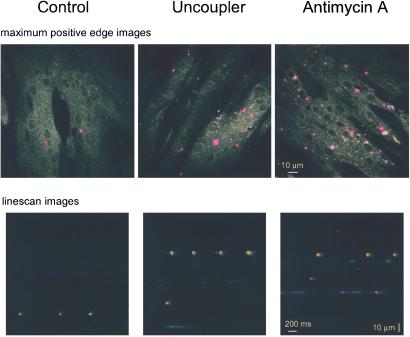
Figure 5.
Mitochondrial Ca2+ uptake controls [Ca2+]c sparks in intact myotubes. (Upper) Two-dimensional images of localized [Ca2+]c signals recorded in fluo3-loaded myotubes exposed to solvent (Left), FCCP (5 μM, Uncoupler; Center), or antimycin A (5 μM, Right) in the presence of oligomycin. The gray images show the fluo3 fluorescence. The purple overlays show the maximal fluorescence increase for each pixel (maximal positive edge), calculated by subtraction of sequential images in 15 image sequences. Thus, the overlays indicate all regions that displayed [Ca2+]c responses during the image series. (Lower) Linescan images showing [Ca2+]c sparks in fluo3-loaded myotubes exposed to solvent (Left), FCCP (5 μM, Uncoupler; Center), or antimycin A (5 μM, Right) in the presence of oligomycin.

