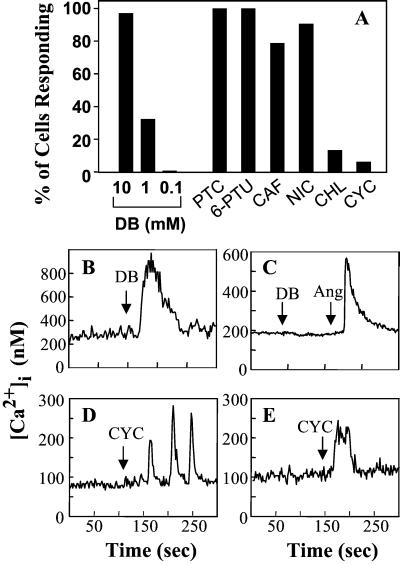
Figure 6.
STC-1 cells respond to bitter tastant molecules with an increase in [Ca2+]i. The [Ca2+]i of individual cells was measured before and after exposure to single concentrations of bitter tastants. (A) Percent of cells that responded to each tastant: DB, denatonium benzoate at 10 mM (n = 160 cells), 1 mM (n = 98 cells), 0.1 mM (n = 82 cells); PTC, phenylathiocarbamide at 3 mM (n = 60 cells); 6-PTU, 6-n-propyl thiouracil at 1 mM (n = 63 cells); CAF, caffeine at 10 mM (n = 52); NIC, nicotine at 10 mM (n = 53 cells); CHL, chloroquine at 1 mM (n = 52 cells); CYC; cycloheximide at 50 μM (n = 538 cells). The values in parenthesis are the number of cells analyzed. (B) Typical individual trace of [Ca2+]i from a single STC-1 cell exposed to 10 mM denatonium benzoate (DB). (C) Typical individual trace of [Ca2+]i from a single IEC-6 cell exposed sequentially to 10 mM denatonium benzoate (DB) followed by 50 nM angiotensin II (Ang), added as a positive control. (D) Individual trace of [Ca2+]i from a single STC-1 cell exposed to 50 μM cycloheximide (CYC) that displayed an oscillatory response. (E) Individual trace of [Ca2+]i from a single STC-1 cell exposed to 250 μM cycloheximide (CYC) that displayed a peak and plateau response. The addition of the tastant or agonist is marked by the arrow.

