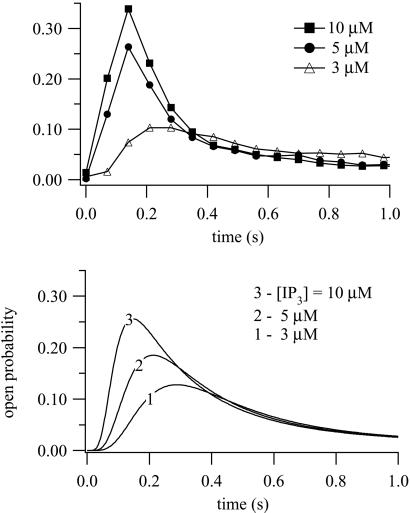
Figure 5.
(Upper) Data obtained from superfusion of 45Ca2+-loaded hepatic microsomes. At t = 00.4 μM, Ca2+ and the indicated [IP3] were added to the stimulus buffer and the Ca2+ flux measured as a function of time. Full details are given in ref. 18. (Lower) Model IP3 dose responses. Initial conditions were R = 1; all other receptor states were zero (i.e., low Ca2+, low IP3). At t = 00.4,μM Ca2+ was added, together with the indicated [IP3].

