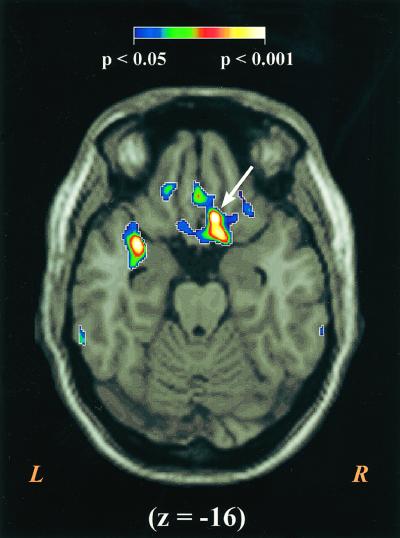
Figure 1.
The figure displays the VMPFC area where rCBF correlates with NA in Study 1. For display purposes the correlation maps were resampled to 1 mm3 pixels, thresholded to only show areas with significant correlations, and overlayed on a high-resolution, Talairach-warped MRI template. The correlations are color coded by their level of statistical significance with areas in purple equivalent to P < 0.05, and areas in white equivalent to P < 0.001. The figure displays a transverse slice through z = −16 with the peak area of correlation marked with an arrow. A highly significant correlation can also be seen in the left parainsular region, but this focus failed to replicate. R, right; L, left.

