
Figure 5.
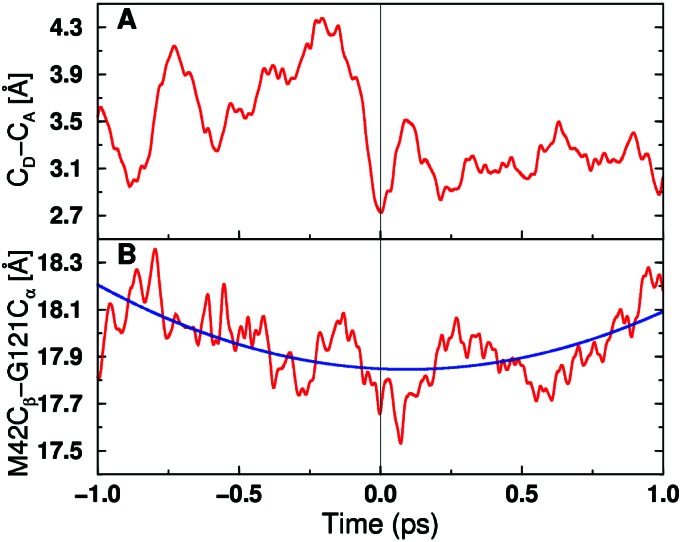
Time evolution of two select distances for a representative real-time vibrationally adiabatic trajectory. (A) Donor-acceptor distance. (B) Distance between Cα of Gly-121 and Cβ of Met-42. Time t = 0 corresponds to the transition state, and the reaction evolves toward the reactant/product as the time becomes negative/positive. For B, the blue curve indicates a fit to a frequency on the picosecond time scale.