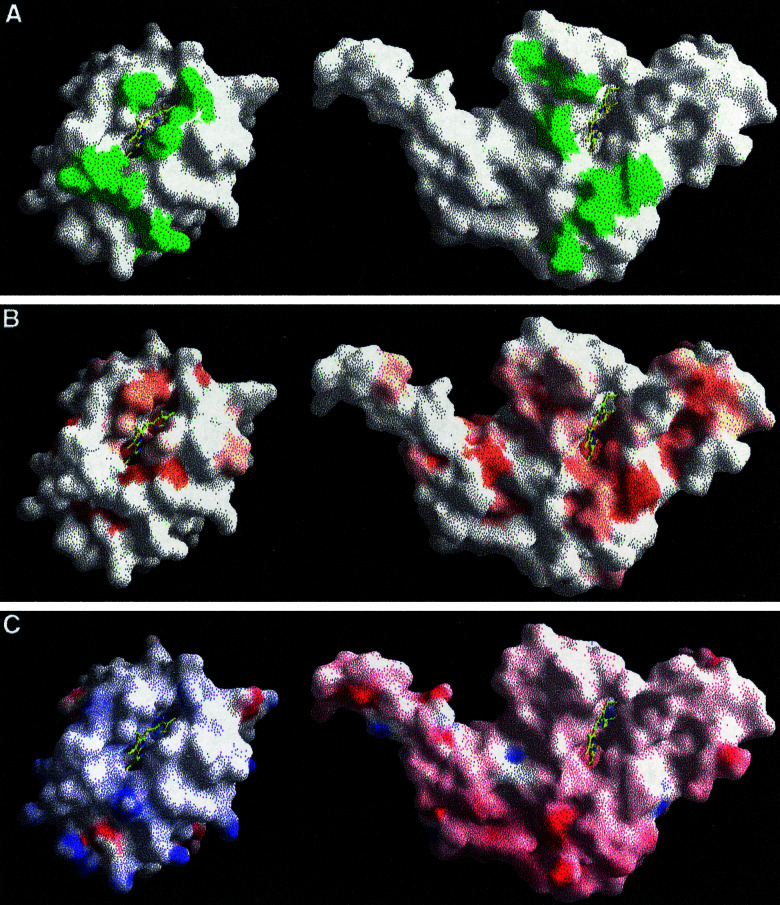
Figure 2.
The complementary recognition sites in the QCR/CYC complex. Surface representations of CYC and CYT1 are shown on Left and Right, respectively. (A) Residues that are involved in CYC binding and have intermolecular contacts of less than 4 Å are colored in green. (B) Residues, which are hydrophobic, are colored in orange. (C) Side chains, which have positive or negative full charges, are colored in blue or red, respectively. Color maxima correspond to +25 and −25 kBT. The figure was generated by using grasp (38).

