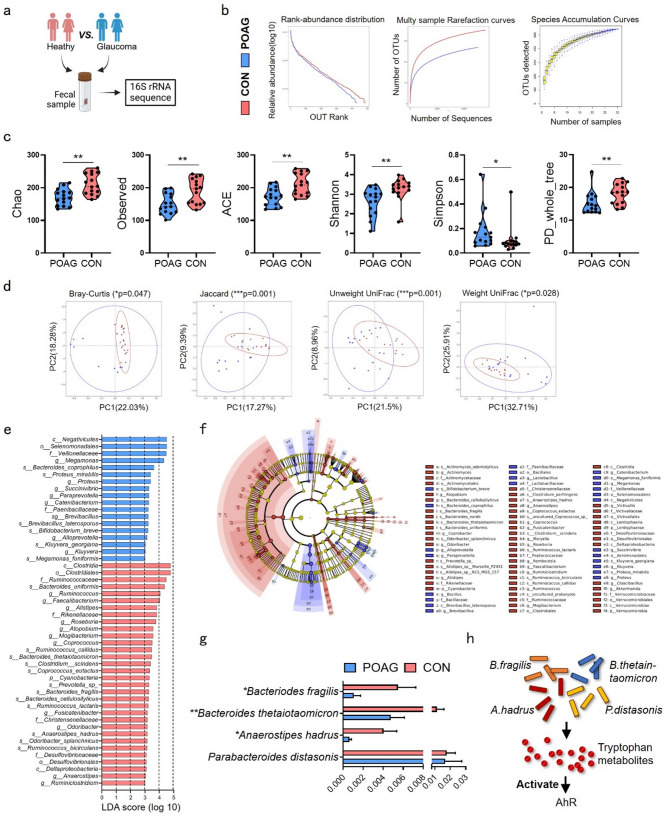
Fig. 1.
Microbial atlas in POAG patients and healthy controls. (a) Fecal sample from heathy control and POAG patients were collected for 16 S rRNA sequence. (b) Rank abundance distribution, Multy sample rarefaction curves and Species accumulation curves. (c) Richness and evenness of gut microbiome were evaluated by Alpha-diversity indexes including Chao, Observed, ACE, Shannon, Simpson and PD whole tree. (d) Beta-diversity was showed by measuring Bray-Curtis, Jaccard, Unweight UniFrac and Weight UniFrac indexes. (e) LefSe was used to identify differences of bacterial taxa between the two groups. Taxa with LDA scores > 3 were showed under Kruskal-Wallis test. (f) The cladograms were constructed with LefSe analysis. (g) Comparations of four tryptophan-metabolizing bacteria between two groups were showed. (h) The diagram showed that four tryptophan-metabolizing bacteria activated AhR by producing tryptophan metabolites. POAG, POAG patients; CON, healthy control. Data represented the mean ± SEM, *P < 0.05, **P < 0.01. Alpha-diversity was showed under non-parametric Wilcox test, Beta-diversity were showed under MRPP

